Quick Takes
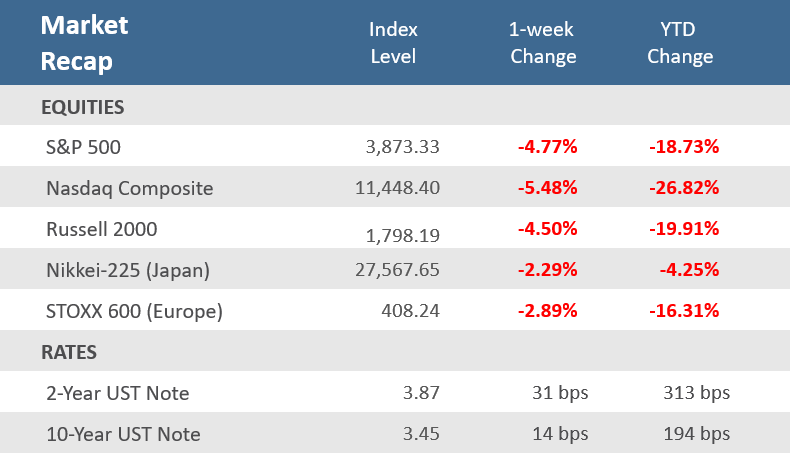
- Stocks and bonds couldn’t withstand hotter-than-expected inflation data, as stocks sank and yields soared following Tuesday’s consumer price index (CPI) unexpected rise. The S&P 500 and Nasdaq had their worst week since June, falling -4.8% and -5.5% respectively. The two-year Treasury yield rose to 3.9%, its highest level since 2007.
- The Labor Department’s CPI report showed that consumer prices rose by +0.1% in August from July, and +8.3% above their year-earlier level. Core CPI, which excludes food and energy, increased +0.6% for the month of August, twice July’s +0.3% rise, and was up +6.3% for the year, above expectations for a +6.1% rise.
- Following the CPI report, the fed funds futures market shifted noticeably higher and is now pricing in a 100% probability of a rate hike of at least 75 basis points at this week’s FOMC meeting, according to the CME FedWatch Tool, and also expect the Fed to hike rates to about 4.50% by the first quarter of next year.
Stocks and Bonds sink on strong inflation data
Stocks fell and bond yields rose on the heels of hotter-than-expected August inflation data. On Tuesday, the Labor Department reported that the rate of consumer price inflation (CPI) remained close to a four-decade high, rising +8.3% in August from the same month a year ago. Other inflation data later in the week didn’t help matters, as the Producer Price Index (PPI) noted a rise in its core rate—which excludes food and energy—and the Import Price Index declined less than forecasts. With the heavy consensus being for the pace of inflation to slow, the surprise upside sent stocks reeling, Treasury yields soaring, and the U.S. dollar’s resuming its rally. Equities ended the day broadly lower in heavy trading and they never managed to recover, posting a large weekly decline. The major U.S. averages suffered their fourth losing week in five, with the S&P 500 down -4.8%, the Nasdaq Composite off -5.5%, and the small-cap Russell 2000 Index down -4.5%. For the S&P 500 and Nasdaq, it was their worst week since June. The hot inflation readings solidified expectations that the Fed will remain aggressive with monetary policy. Markets are pricing in a 75-basis-point* rate hike as the likely outcome of this week’s Federal Reserve meeting.
Treasury yields, particularly on the short end of the yield curve, sailed higher on the stubborn inflation data. The 2-year Treasury note yield, which is more sensitive to changes in the Fed funds rate, rose 31 basis points this week to 3.87%, its highest level since October 2007. The 10-year Treasury yield rose 14 basis points over the week, to 3.45%. Also this week, for the first time since 2008, the yield on the 3-month U.S. Treasury bill moved above 3%, to 3.1%. Bond prices move inversely with yields, and the boost in yields meant the Bloomberg U.S. Aggregate Bond Index lost -0.9% for the week, its fifth straight weekly decline. A silver lining for the rising rates is that the yield on BBB-rated corporate bonds now exceeds the earnings yield for the S&P 500 Index for the first time in 12 years, making fixed income a more attractive alternative to stocks.
Other economic data released during the week mostly supported the Fed’s case more aggressive monetary policy. Retail Sales were stronger than expected, preliminary consumer sentiment increased from the prior month, small business optimism improved, and weekly jobless claims continued to fall. However, industrial production and capacity utilization were weaker than expected, and both the NY and Philadelphia Fed regional manufacturing surveys are in contraction territory. Still, that’s not likely to deter the Fed, futures markets expect the Fed to hike rates to about 4.50% by the first quarter of next year, which is about a half-percent higher than before Tuesday’s CPI report.
Chart of the Week
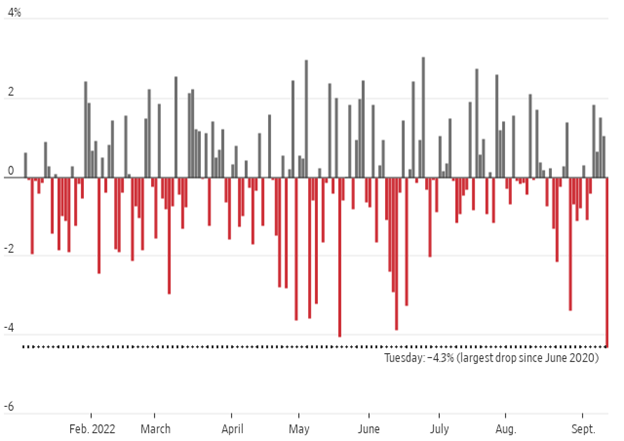
Just a day after starting the week with a rally on expectations that the Consumer Price Index (CPI) would show cooling inflation in August, on Tuesday the S&P 500 sank -4.3%, the largest one-day decline since June 2020. Rather than cooling, Tuesday’s Labor Department report instead showed that consumer prices rose by +0.1% in August from July, putting them +8.3% above their year-earlier level. That was above economists’ expectations for a -0.1% monthly decline and for a year-over-year increase of +8.1% (though it was down from July’s unrevised annual rate of +8.5%). Even more disappointing for investors, the Core CPI, which strips out the more volatile food and energy components, increased +0.6% for the month of August, twice July’s unrevised +0.3% rise where it was expected to remain. Compared to last year, Core CPI was up +6.3%, above expectations for a +6.1% rise and above July’s +5.9% increase. The hotter-than-expected inflation data means that the Federal Reserve is likely to keep raising rates through December, and possibly at least their first meeting next year. As shown in the chart below, Tuesday’s big decline was the largest in two years and only the second decline of -4 or worse in 2022. Bond investors were spooked too. The two-year U.S. Treasury yield, the most sensitive to Fed policy changes, jumped as much as 22 basis points, pushing it more than 30 basis points above the 10-year yield, deepening the yield curve inversion.
Markets Didn’t Like Tuesday’s Inflation Report
S&P 500 daily price changes in 2022
Economic Review
- The August Producer Price Index (PPI), which measures what suppliers are charging businesses and other customers, showed prices at the wholesale level slid -0.1% for the month, in line with expectations and above July’s upwardly revised -0.4% drop. Year-over-year, the headline PPI was up +8.7%, below expectations of +8.8%, and below July’s unadjusted 9.8% rise. Core PPI, which excludes food and energy, rose +0.4% in August, above expectations for +0.3% and above July’s upwardly revised +0.3% rise. Year-over-year Core PPI was up +7.3%, above the expectation of +7.0% but below July’s unadjusted +7.6% increase.
- The August Import Price Index fell -1.0% for the month, worse than expectations of a 1.3% drop, but better than July’s negatively revised -1.5% decrease. Compared to a year ago, prices were up by +7.8%, above expectations of +7.7% but below July’s downwardly revised +8.7% rise. Import prices excluding petroleum were down -0.2% in August, less than expectations for a decline of -0.6%. Lower fuel prices and the strong dollar accounted for much of the decline. Lower import prices can act as a brake on inflation.
- The August National Federation of Independent Business (NFIB) Small Business Optimism Index increased to 91.8 from 89.9 in July, beating expectations for a 90.8 reading. The gain reversed some of the declines in the first half of the year. 29% of business owners noted that inflation was their single most important problem in operating their business. The NFIB said, “The small business economy is still recovering from the pandemic while inflation continues to be a serious problem for owners across the nation. Owners are managing the rising costs of utilities, fuel, labor, supplies, materials, rent, and inventory to protect their earnings.”
- The preliminary University of Michigan Consumer Sentiment Index for September improved less than expected, rising to 59.5 from August’s final reading of 58.2, but was under expectations for a rise to 60.0. Still, the September results continued to move off the record low reading from June as the Expectations component of the report increased noticeably to add to a modest rise in the Current Conditions component. The 1-year inflation forecast decreased to 4.6% from 5.0% in August, and the 5-10-year inflation forecast decreased to 2.8%, from 3.0%, falling below the long-run range of 2.9%-3.1% for the first time since July 2021.
- The advance Retail Sales for August rose +0.3%, better than expectations of +0.1%, and much better than July’s downwardly adjusted -0.4% decline. Sales ex-autos decreased -0.3% for the month, below expectations for a flat reading, and July’s figure was revised down to an unchanged reading. Sales ex-autos and gas were up +0.3% for the month, below expectations of +0.5%, and in line with July’s downwardly revised gain. The Control Group, a figure used to calculate GDP, came in unchanged for the month, under expectations for a +0.5% gain, and below July’s downwardly revised +0.4%.
- August Industrial Production fell -0.2% for the month, below expectation to remain flat, and far below July’s downwardly revised +0.5% gain. Manufacturing output ticked +0.1% higher, mining output was little changed, and utility consumption fell -2.3%. Capacity Utilization declined to 80.0%, missing expectations to match the prior month’s downwardly revised 80.2% rate, but remains slightly above its long-run average.
- The September Empire Manufacturing Index, a measure of activity in the New York region, improved more than expected but remained in contraction territory (a reading below zero), rising to -2.5 from the -31.3 reading in August and better than expectations for an improvement to -12.9.
- The September Philly Fed Manufacturing Business Outlook Index unexpectedly fell into contraction territory (a reading below zero), dropping to -9.9, worse than the expected decrease to 2.3, and far below August’s 6.2 level.
- The weekly MBA Mortgage Application Index declined for a fifth straight week to -1.2% from the prior week’s -0.8% decline. The Refinance Index fell -4.2% from last week and the Purchase Index was up +0.2% for the week. The decline came as the average 30-year mortgage rate rose 7 basis points to 6.01% and is up +2.98 percentage points from last year.
- Weekly Initial Jobless Claims were 213,000 for the week ended September 10, under expectations of 227,000, and down from the prior week’s downwardly revised 218,000. Continuing Claims for the week ended September 3 rose 2,000 to 1,403,000, below expectations of 1,478,000.
The Week Ahead
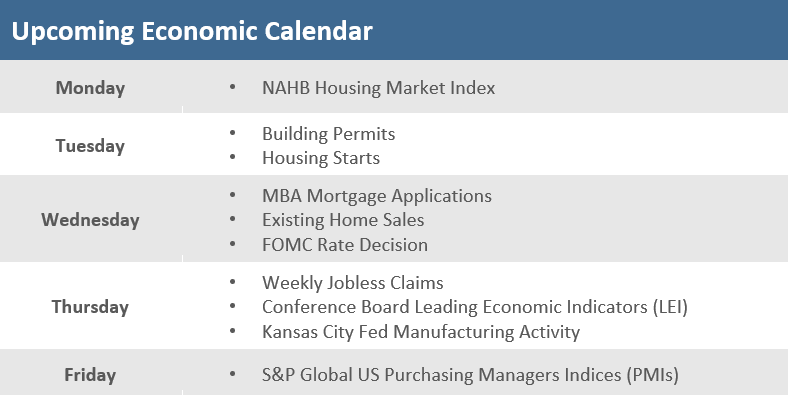
Economic releases for the coming week include a bevy of housing reports with Homebuilder Confidence, Building Permits, Housing Starts, Existing Home Sales, and weekly Mortgage Applications. But the heavy focus will be on the Federal Open Market Committee’s (FOMC) decision on Fed Funds Rates. Current expectations are that the Fed’s policy-making committee will hike rates by 75 basis points at the two-day meeting slated to begin on Tuesday. Economists expect the statement from the FOMC to indicate that monetary policy will be restrictive for some time, while the tone of the Jerome Powell’s press conference could increase the view that a hard landing for the economy is more likely than a soft landing as a result of the overarching goal of combating inflation to achieve price stability. There are a few earnings reports, including Costco and General Mills. Investors are also watching out for any warnings from companies ahead of the next earnings season, particularly after FedEx talked about softness in deliveries globally and withdrew its earnings guidance last week.
Did You Know?
FLAT INCOMES – U.S. mortgage rates touched their highest level since November 2008 during the week, another hurdle for the rapidly cooling housing market. The average rate on a 30-year fixed mortgage rose to 5.89%, topping an earlier high in June. This time last year, rates were 2.88%. The 3% spike in mortgage rates over the last year is the largest 1-year increase since 1980-81 (source: Freddie Mac, The Wall Street Journal).
ALL-OR-NOTHING DAYS – Market “Breadth” is an indicator that evaluates the pattern of advancing and declining stocks. “All or nothing days” are days where the net daily breadth for the S&P 500 companies is greater than +400 or less than -400 (i.e. lockstep moves in which 400 of the 500 stocks are either advancing or declining together). On Tuesday, 492 of the S&P 500 stocks were down, but during the prior week, Wednesday and Friday saw 450 and 403 stocks advance, respectively. With three all-or-nothing days in the past two weeks, and with 27 so far this year, 2022 is on pace to hit nearly 40 all-or-nothing. If that pace holds, it will rank as the third-highest total since the end of the Financial Crisis and the 7th highest total for all years since 1990—although the period before 2000 hardly counts, because all-or-nothing days were so rare before then. There were 43 all-or-nothing days in 2020, but before that, you must go back to 2015 for the last year there were 40 such days. The record was 71 all-or-nothing days in 2011 (source: Bespoke Investment Group, Bloomberg).
SLACKERS NO MORE – Median household income was essentially unchanged at $70,800 last year after adjusting for inflation, according to the U.S. Census. The flat reading for 2021 follows a decline in 2020, the first year of the pandemic. The poverty rate in 2021 was 11.6%, also unchanged from 2020. Roughly 37.9 million people lived in poverty last year. The poverty threshold for a four-person household last year was $27,740 (source: The Wall Street Journal).
This Week in History
DUN DUN – On September 13, 1990, a new show called “Law & Order” debuted on NBC. “Law & Order” opened to little fanfare, but it has gone on to become one of the most successful and long-running franchises on TV. At the peak of broadcast TV, there probably wasn’t a time of day that the show or one of its numerous spin-offs was not airing somewhere on cable TV, and the famous “dun dun” sound effect has become one of the most recognizable sounds on TV. When “Law & Order” first aired, the reviews weren’t positive. The Hollywood Reporter called the show “a program that fails to properly function.” Based on the initial reviews, it’s hard to imagine that the original episode in 1990 would spawn 32 years of success. Sometimes investors face markets that may seem to “fail to properly function”, but with time and discipline, something that may look less than desirable today can turn into something valuable in the future (source: Bespoke Investment Group).
Asset Class Performance
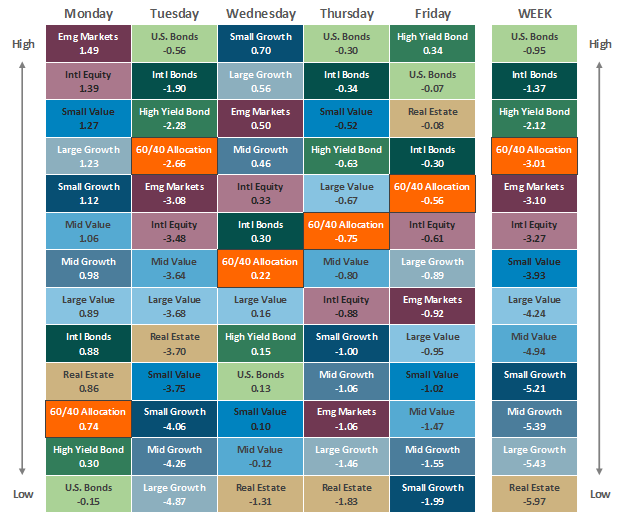
The Importance of Diversification. Diversification mitigates the risk of relying on any single investment and offers a host of long-term benefits, such as lowering portfolio volatility, improving risk-adjusted returns, and helping investments to compound more effectively.
Source: Bloomberg. Asset‐class performance is presented by using market returns from an exchange‐traded fund (ETF) proxy that best represents its respective broad asset class. Returns shown are net of fund fees for and do not necessarily represent the performance of specific mutual funds and/or exchange-traded funds recommended by The Retirement Planning Group. The performance of those funds may be substantially different than the performance of the broad asset classes and to proxy ETFs represented here. U.S. Bonds (iShares Core U.S. Aggregate Bond ETF); High‐Yield Bond (iShares iBoxx $ High Yield Corporate Bond ETF); Intl Bonds (SPDR® Bloomberg Barclays International Corporate Bond ETF); Large Growth (iShares Russell 1000 Growth ETF); Large Value (iShares Russell 1000 Value ETF); Mid Growth (iShares Russell Mid-Cap Growth ETF); Mid Value (iShares Russell Mid-Cap Value ETF); Small Growth (iShares Russell 2000 Growth ETF); Small Value (iShares Russell 2000 Value ETF); Intl Equity (iShares MSCI EAFE ETF); Emg Markets (iShares MSCI Emerging Markets ETF); and Real Estate (iShares U.S. Real Estate ETF). The return displayed as “Allocation” is a weighted average of the ETF proxies shown as represented by: 30% U.S. Bonds, 5% International Bonds, 5% High Yield Bonds, 10% Large Growth, 10% Large Value, 4% Mid Growth, 4% Mid Value, 2% Small Growth, 2% Small Value, 18% International Stock, 7% Emerging Markets, 3% Real Estate.
Chris Bouffard is CIO of The Retirement Planning Group (TRPG), a Registered Investment Adviser. He has oversight of investments for the advisory services offered through TRPG.
Disclaimer: Information provided is for educational purposes only and does not constitute investment, legal or tax advice. All examples are hypothetical and for illustrative purposes only. Past performance of any market results is no assurance of future performance. The information contained herein has been obtained from sources deemed reliable but is not guaranteed. Please contact TRPG for more complete information based on your personal circumstances and to obtain personal individual investment advice.


