Quick Takes
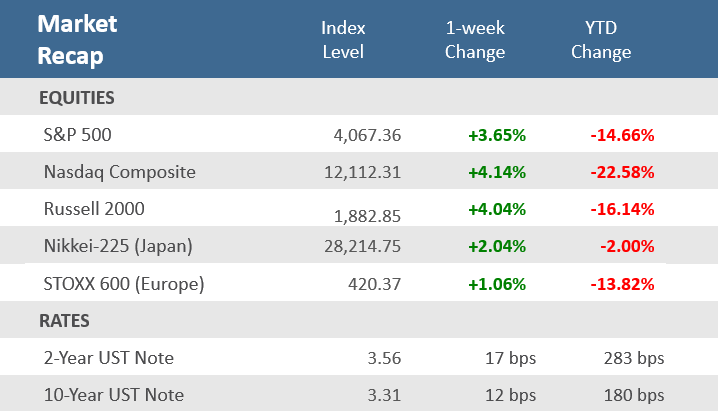
- Stocks were able to withstand hawkish central banks, rising bond yields, and mixed economic data to break a three-week losing streak and finish the holiday-shortened week with solid gains. The S&P 500 index rebounded +3.7%, the small cap Russell 2000 Index was up +4.0%, and the tech-heavy Nasdaq Composite gained +4.1%.
- Bonds weren’t as fortunate as stocks as the Fed reiterated their hawkishness stance. U.S. Treasury yields continued their climb over the week with the 2-year note yield up 17 basis points to 3.57%, while the 10-year note yield rose 12 basis points to 3.32%. As a result, the Bloomberg U.S. Aggregate Bond Index slid -0.7%, its fourth straight weekly decline.
- The little economic data reported during the week was mixed. The U.S. services sector either expanded or contracted depending on if it was measured by the ISM or by competing firm S&P Global. The Fed’s Beige Book suggested supply chain issues and the inflation picture may be improving, but on balance activity was relatively flat across the 12 Districts.
Stocks break three-week slide despite Fed’s hawkishness
Stocks finished out the Labor Day-shortened week in the green, snapping a three-week losing streak. It was an impressive showing for stocks in the face of Fed Chairman Jerome Powell and other Fed officials reiterating their hawkish resolve that sent Treasury yields higher. Other central banks also made hawkish moves to combat inflation. The European Central Bank announced a 75-basis point (0.75%) hike on Thursday, the largest hike in its history. Also, this week, the Bank of Canada raised rates from 0.75% to 3.25% and the Reserve Bank of Australia hiked 0.5% to 2.35%. Still, stocks didn’t buckle under the pressure of aggressive central banks and rising yields.
In the end, the S&P 500 index rebounded +3.7% for the week, the small cap Russell 2000 Index was up +4.0%, and the tech-heavy Nasdaq Composite gained +4.1%. Gains were robust with all 11 S&P 500 sectors making gains that ranged from +0.6% (Energy) to +5.6% (Consumer Discretionary), and eight sectors up at least +3.2%. Stock’s resilience might just have been a result of how short-term oversold they had gotten. After three weeks of losses, plus the slide on Tuesday, the S&P 500, Russell 2000, and Nasdaq were down -9.2%, -11.3%, and -11.8%, respectively, from their August 16 highs. The American Association of Individual Investors Investor Sentiment Survey also reflected those oversold conditions with unusually high bearish sentiment and unusually low bullish sentiment.
Bonds weren’t as fortunate as stocks in the wake of the hawkishness of the Fed and other central banks. U.S. Treasury yields continued their climb over the week with the 2-year note yield up 17 basis points to 3.57%, while the 10-year note yield rose 12 basis points to 3.32%. As a result, the Bloomberg U.S. Aggregate Bond Index slid -0.7% for the week, its fourth straight weekly decline and the fifth down week in the last six. Outside of stocks and bonds, the U.S. dollar made a 20-year high during the week, although it retreated at the end of the week. Additionally, crude oil prices fell for a second-straight week.
Economic data was sparse during the week, and results were mixed. As discussed in the Chart of the Week, services sector economic activity showed conflicting results from the two separate date firms that report them. The ISM Services PMI Index showed unexpected growth in the key services sector, while the competing S&P Global Service PMI showed a worse-than-expected economic contraction. The Fed’s Beige Book suggested supply chain issues and the inflation picture may be starting to improve, but overall activity was relatively unchanged on balance across the 12 regional Fed Districts.
Chart of the Week
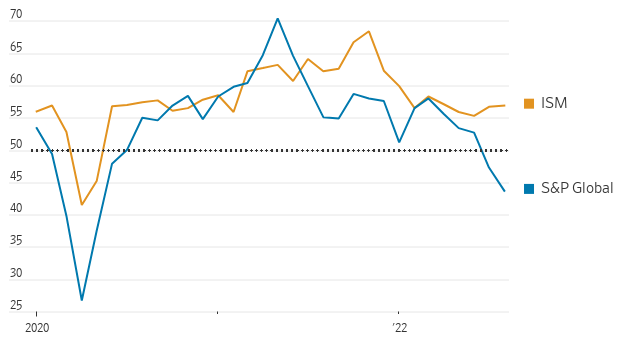
Did the key U.S. services sector of the economy expand or contract in August? It’s not a trivial question because the services sector—a broad category of the economy that includes financial services, media, transportation, and technology—represents about 80% of U.S. employment and economic output. The answer of how it is doing depends on which of the two separate surveys is being referenced. The Institute for Supply Management (ISM) Purchasing Managers Index (PMI) reported that the U.S. services sector unexpectedly grew faster in August than in July. The ISM Services PMI rose to 56.9, slightly higher than the 56.7 reading in July, and above expectations for a decline to 55.1. According to the ISM data, economic activity in the services sector has now grown for 27th consecutive months. But the competing data firm S&P Global reported results showing that the services sector shrank faster in August than in July due to weak demand. The final reading on the S&P Global U.S. Services PMI Index for August showed services sector growth fell to 43.7, worse than the expectations for a decline to 44.3 and down from 47.3 in July. As shown in the chart below, it was the largest discrepancy between the two data providers in recent years and led to conflicting conclusions. ISM and Markit both conduct their business surveys monthly to measure the strength of the economy and both are diffusion indexes where readings above 50 indicate economic expansion and readings below 50 indicate economic contraction. However, the two surveys differ in methodology which can lead to occasional, and meaningful, divergences. The ISM surveys company purchasing managers, while S&P Global also surveys other executives. The ISM surveys a broader set of industries—including construction, mining, utilities, and government—that the S&P survey excludes. However, S&P Global surveys nearly 800 manufacturing companies, approximately double the size of the ISM poll size. Also, ISM surveys are by ISM members, which tends to reflect business conditions in larger companies, whereas S&P Global also captures small- and mid-sized firms.
Mixed Signals
U.S. service-sector purchasing managers’ indexes
Note: Readings above 50 indicate activity is expanding, below 50 contracting.
Source: Institute for Supply Management, S&P Global, The Wall Street Journal.
Economic Review
- The Fed Beige Book—an anecdotal read on national business activity used by Fed officials to prepare for their next monetary policy decision that is set to come during the next FOMC meeting on September 21—showed that, on balance, economic activity in all 12 Federal Reserve Districts was mostly unchanged. Activity had slight to modest growth in five Districts, another five reported slight to modest softening, while the other two Districts held steady. Most Districts reported steady consumer spending, as households started to shift spending away from discretionary goods and towards food and other essential items. Manufacturing activity grew in several Districts, but the report did note that supply chain and labor shortage issues continued to put a strain on production. Demand for energy products was robust, but production remained constrained due to the low supply of critical components. In another sign of a rapidly slowing housing market, home sales fell in all 12 Districts. Employment rose at a modest to moderate pace in most Districts, and while overall labor market conditions remained tight, labor availability improved. Price levels remained elevated, but nine of the twelve districts did report a degree of moderation in the growth rate.
- July Consumer Credit showed consumers borrowed $23.8 billion in the month, well under expectations for $32.0 billion, and June’s downwardly revised $39.1 billion (originally reported at $40.2 billion). Non-revolving debt, which includes student loans and loans for vehicles and mobile homes, expanded by $12.9 billion, a +4.4% annual increase, while revolving debt, which includes credit cards, gained $10.9 billion, an +11.6% annual rise.
- The Trade Balance showed that the July deficit narrowed by a slightly smaller amount than expected, decreasing to $70.7 billion, from June’s upwardly revised deficit of $80.9 billion, and compared to forecasts of a decline to $70.2 billion. Exports ticked 0.2% higher month-over-month (m/m), and imports fell 2.9% m/m.
- July Wholesale Inventories rose +0.6% for the month, revised down from the previously reported +0.8% gain, where it was expected to remain, and compared to June’s +1.9% increase. Sales were down -1.4%, following June’s downwardly adjusted +1.6% increase.
- The weekly MBA Mortgage Application Index declined for a fourth straight week to -0.8% from the prior week’s -3.7% decline. The Refinance Index fell -1.1% from last week and the Purchase Index was down -0.7% for the week. The decline came as the average 30-year mortgage rate rose 14 basis points to 5.94% and is up +2.91 percentage points from last year.
- Weekly Initial Jobless Claims were 222,000 for the week ended September 3, under expectations of 235,000, and down from the prior week’s downwardly revised 232,000. Continuing Claims for the week ended August 27 rose 36,000 to 1,473,000, above expectations of 1,438,000.
The Week Ahead
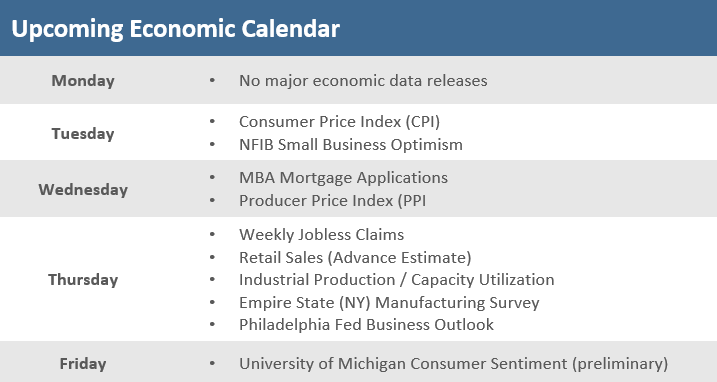
Next week, all eyes will be closely focused on Tuesday’s Consumer Price Index (CPI) report for August, which will be one of the final pieces of data the Fed will see before its September monetary policy meeting. If inflation has fallen more than expected, it could sway the central bank to deliver a smaller rate hike, although most economists don’t expect soft consumer inflation to deter the Fed from a 75-basis point hike. Expectations are for the report to show a slight decline in inflation, possibly in part due to falling oil prices. The August inflation picture will also be filled in by the Producer Price Index (PPI), which reflects prices at the wholesale level, as well as the Import Price Index, which the Fed has highlighted in recent weeks. Other reports due include the preliminary September University of Michigan Consumer Sentiment Index and the September regional manufacturing reports from New York and Philadelphia. Fed officials will be in quiet mode for the week before their monetary policy decision the following week.
Did You Know?
MORTGAGE RATES AT 14-YEAR HIGH – U.S. mortgage rates touched their highest level since November 2008 during the week, another hurdle for the rapidly cooling housing market. The average rate on a 30-year fixed mortgage rose to 5.89%, topping an earlier high from June. This time last year, rates were 2.88%. The 3% spike in mortgage rates over the last year is the largest 1-year increase since 1980-81 (source: Freddie Mac, The Wall Street Journal).
HOUSEHOLD NET WORTH – U.S. household wealth fell -$6.1 trillion in the second quarter. The considerable pullback in equity markets through the first half of 2022 put quite a dent in household wealth, but in the context of historically strong gains over the past two years, it is still up a hefty +$27 trillion from the pre-pandemic levels to put it at a total of $144 trillion. This provides a strong reservoir for consumers to withstand stubbornly high inflation and a slowing economy (source: ING).
SINKING SENTIMENT – Individual investors are feeling less and less cheerful. Bullish sentiment, or expectations that stock prices will rise over the next six months, fell to 18.1% in the latest sentiment survey from the American Association of Individual Investors. That is the lowest reading since April and compares to a historical average of 38.0% (source: AAII, The Wall Street Journal).
This Week in History
PROTECTING – On September 7, 1896, before the internal combustion engine became the standard for American automobiles, an electric car won what may have been the first auto race in the U.S. The 5-mile race was in Cranston, Rhode Island with 7 cars, five that were internal combustion cars and two battery-powered cars. The two electric cars finished in first and second place in the race. The Riker Electric car was the winner. Riker Electric was merged with the Electric Vehicle Co. in 1901. At that time, Electric Vehicle Co. was the largest motor car manufacturer in the U.S. but eventually went bankrupt in 1907. A year later, Ford Motor Company introduced the gas-powered Model T and General Motors Company was founded (source: Benzinga).
Asset Class Performance
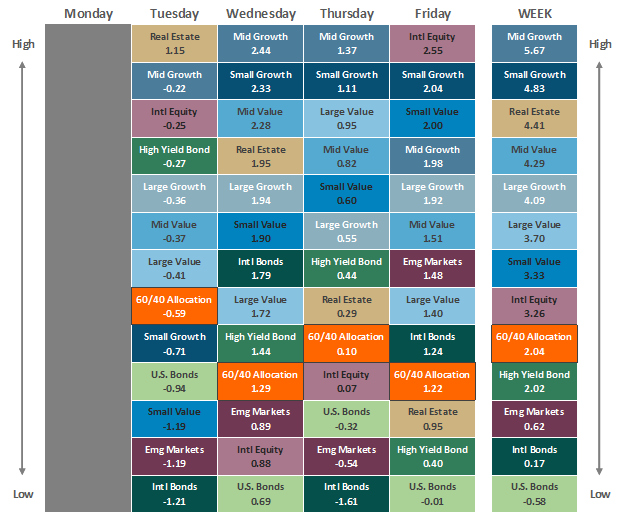
The Importance of Diversification. Diversification mitigates the risk of relying on any single investment and offers a host of long-term benefits, such as lowering portfolio volatility, improving risk-adjusted returns, and helping investments to compound more effectively.
Source: Bloomberg. Asset‐class performance is presented by using market returns from an exchange‐traded fund (ETF) proxy that best represents its respective broad asset class. Returns shown are net of fund fees for and do not necessarily represent the performance of specific mutual funds and/or exchange-traded funds recommended by The Retirement Planning Group. The performance of those funds may be substantially different than the performance of the broad asset classes and to proxy ETFs represented here. U.S. Bonds (iShares Core U.S. Aggregate Bond ETF); High‐Yield Bond (iShares iBoxx $ High Yield Corporate Bond ETF); Intl Bonds (SPDR® Bloomberg Barclays International Corporate Bond ETF); Large Growth (iShares Russell 1000 Growth ETF); Large Value (iShares Russell 1000 Value ETF); Mid Growth (iShares Russell Mid-Cap Growth ETF); Mid Value (iShares Russell Mid-Cap Value ETF); Small Growth (iShares Russell 2000 Growth ETF); Small Value (iShares Russell 2000 Value ETF); Intl Equity (iShares MSCI EAFE ETF); Emg Markets (iShares MSCI Emerging Markets ETF); and Real Estate (iShares U.S. Real Estate ETF). The return displayed as “Allocation” is a weighted average of the ETF proxies shown as represented by: 30% U.S. Bonds, 5% International Bonds, 5% High Yield Bonds, 10% Large Growth, 10% Large Value, 4% Mid Growth, 4% Mid Value, 2% Small Growth, 2% Small Value, 18% International Stock, 7% Emerging Markets, 3% Real Estate.
Chris Bouffard is CIO of The Retirement Planning Group (TRPG), a Registered Investment Adviser. He has oversight of investments for the advisory services offered through TRPG.
Disclaimer: Information provided is for educational purposes only and does not constitute investment, legal or tax advice. All examples are hypothetical and for illustrative purposes only. Past performance of any market results is no assurance of future performance. The information contained herein has been obtained from sources deemed reliable but is not guaranteed. Please contact TRPG for more complete information based on your personal circumstances and to obtain personal individual investment advice.


