Quick Takes
- Stocks and bonds fell for a third-straight week as investors’ hopes that the Fed would pivot to a more dovish stance any time soon were quelled by further hawkish comments from Fed officials following last week’s extremely hawkish message from Fed Chairman Jerome Powell.
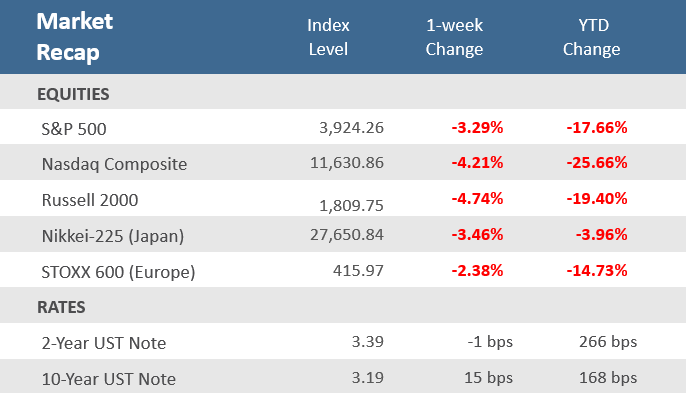
- The S&P 500 fell -3.3% for the week, and small caps were down even more with the Russell 2000 sinking -4.7%. The tech-heavy Nasdaq was off -4.2, taking a big hit from semiconductor stocks, which fell about -7% after the U.S. prohibited Nvidia from selling some of its products to China.
- Bonds declined for the week, as the markets are still pricing in an increase of 75 basis points (bps) for the Fed’s target rate at the September FOMC meeting. The Bloomberg U.S. Aggregate Bond Index slid -1.0%, putting the benchmark bond index back in correction territory for the year (-10.9%).
Stocks and bonds decline for a third straight week
Stocks and bonds fell for a third-straight week as investors adjust to last week’s hawkish message from Fed Chairman Jerome Powell at the Jackson Hole symposium, as well as other comments from Central Bank officials that essentially quelled all hopes that the Fed would pivot to a more dovish stance any time soon. Large-cap stocks dropped with the S&P 500 losing -3.3% for the week, and small caps were down even more with the Russell 2000 sinking -4.7%. The tech-heavy Nasdaq was off -4.2, taking a big hit from semiconductor stocks after the U.S. prohibited Nvidia from selling some of its products to China.
The good-news-is-bad-news trend returned as economic data released during the week supported the case for the Fed to be more aggressive to combat inflation. JOLTS job openings data exceeded expectations, weekly jobless claims came in less than expected, the ISM manufacturing PMI was better than expected, consumer confidence rebounded more than expected, and the week concluded with a stronger-than-expected August employment report. Some areas of weakness were reported though, specifically among housing data as rising rates and elevated home prices continue to hamper that market. Mortgage applications fell for the third consecutive week and both the FHFA and the S&P CoreLogic Case-Shiller home price indexes decelerated.
Bonds also declined over the week, as the markets are still pricing in an increase of 75 basis points (bps) for the Fed’s target rate at the September FOMC meeting. The Bloomberg U.S. Aggregate Bond Index slid -1.0%, putting the benchmark bond index back in correction territory for the year (-10.9%). The Treasury yield curve steepened with the yield on the U.S. 10-year Treasury up 15 basis points (bps) while the 2-year Treasury yield slid 1 bps. The U.S. dollar resumed its rally, notching its highest closing level since June 2002.
Chart of the Week
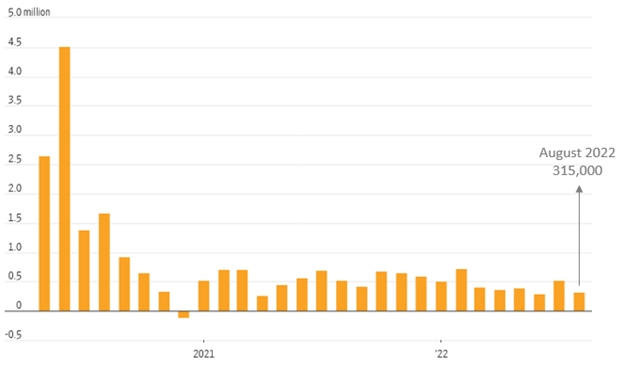
The August employment report was largely better than expected showing solid hiring, rising labor force participation, and moderating wage growth. Nonfarm payrolls rose by 315,000 jobs in August, beating expectations for a 298,000 increase, although July was adjusted lower to an increase of 526,000 from the initial reading of 528,000 jobs. Job gains were balanced across industries, with notable increases in professional and business services, health care, and retail trade. The Labor Force Participation Rate rose to 62.4%, up from an unrevised 62.1% in July, and was better than expectations for 62.2%. Prime-age workers led the participation rate increase, moving up to 82.8% in August from 82.4% in July. That’s good news for the Fed because a rising labor supply may help moderate wage costs and thus inflation — helping the chances for a soft landing that they seek to achieve. For August, Average Hourly Earnings were up +0.3% which was below expectations for a gain of +0.4%, and down from July’s unadjusted +0.5% increase. Compared to last year, wages were up +5.2%, which was also slightly under expectations for +5.3%, and in line with July’s unadjusted rise. On the downside, the Average Weekly Hours Worked slipped to 34.5 from 34.6 in July where it was expected to remain. Also, the Unemployment Rate rose to 3.7% from 3.5%, where it was expected to remain. The driver of the increase from people who weren’t in the labor force before that are now looking for a job, not because existing workers are being laid off.
August Jobs Report Mostly Better than Expected
Nonfarm payrolls, monthly net change
Source: Labor Department, The Wall Street Journal.
Economic Review
- The August Institute for Supply Management (ISM) Manufacturing Index beat expectations but remained at the lowest level since June 2020, holding at July’s 52.8 level, versus the expectations for a decrease to 51.9. The stronger-than-expected report came as new orders rose back into expansion territory (above 50), though production growth slowed, and inventories declined. Employment rose and moved into expansion territory, and supplier delivery times shortened slightly. Inflation pressures eased noticeably, with the Prices Index falling to 52.5 from 60.0. The ISM said, “Sentiment remained optimistic regarding demand, with five positive growth comments for every cautious comment.” However, ISM noted that panelists continue to express unease about a softening economy, and they are seeing growing worries about total supply chain inventory. The ISM data is based on responses from over 400 manufacturing purchasing executives from 20 industries, which correspond to their contribution to GDP in 50 states.
- S&P Global’s final August U.S. Manufacturing Purchasing Manager Index (PMI) was revised up to 51.5, versus the expectation for it to be unrevised at 51.3. That was below 52.2 in July. S&P Global’s report differs from the ISM report as it surveys a more diverse range of companies regarding size.
- The Conference Board’s Consumer Confidence Index rebounded +8.3% to 103.2 in August from July’s downwardly revised 95.3 level, beating expectations of 98.0. It was the first monthly gain since April’s +0.9% gain and matched May’s index level, but it was still down from last August’s 115.2. Consumers’ views of the present and future economic conditions improved this month. The Present Situation Index rose +4.1% to 145.4 for the month, the first monthly gain for the component since March, which follows a -5.1% drop to 139.7 in July. However, the index was down -2.4% year over year. The Expectations Index, consumers’ view of business conditions for the next six months, popped +14.5% to 75.1, its first monthly advance, and its highest level, since April, after a -0.3% decline to a nine-year-low of 65.6 in July. It is still at historically low levels, down -32.9% since the recent peak of 111.9 in March 2021 and -19.1% from last August. Even with the August improvement in confidence, the Expectations Index remains below 80.0, which suggests the continued presence of an elevated risk of recession. Fortunately, inflation expectations eased this month, though they remain at an elevated level, with the expected inflation rate in twelve months slipping to 7.0% in August from 7.4% in July.
- Factory Orders for manufactured goods fell -1.0% in July, far below expectations for a +0.2% increase and the prior month’s +1.8% gain (revised lower from +2.0%). Durable Goods Orders—preliminarily reported last week—were revised down to a -0.1% decline after increasing +2.3% in June. Excluding transportation, orders were adjusted downward to a +0.2% gain. Finally, nondefense capital goods orders excluding aircraft—a proxy for business spending—were revised downward to a +0.3% increase from +1.0% in June. It was the first decline in order activity in 10 months, but it’s too early to tell if it was simply a natural pullback after an extended period of new order increases versus a meaningful turning point lower.
- The August Dallas Fed Manufacturing Index improved but is still in contraction territory (readings below zero), rising to -12.9 from -22.6 in July, slightly below expectations to improve to -12.7. The increase in August from July, which was the lowest level in two years, was led by new orders, although they remain negative, as well as continued expansion in production and shipments. Employment is still in expansion territory but decelerated, while inflation moderated as both prices paid and received decelerated.
- The pace of home price growth may have reached an inflection point in June. The Federal Housing Finance Agency (FHFA) House Price Index rose +0.1% in June, following a +1.3% rise in May, revised down from +1.4%. The slight rise in June broke a streak of 24 consecutive monthly increases of +1% or higher. The year-on-year increase was +16.2%, which was down from +18.3% in May. Similarly, the S&P CoreLogic Case-Shiller National Home Price Index, which measures average home prices in major metropolitan areas across the U.S., rose +18% from June last year, down from a +19.9% annual rate the prior month.
- July Construction Spending fell -0.4%, worse than expectations for a -0.2% decline, but better than June’s upwardly revised -0.5% fall. Year-over-year, total construction spending was up +8.5%. Residential spending fell -1.5% for the month, while non-residential spending rose +0.8%. This represents a continued downturn in residential spending and is consistent with the recent weak homebuilder sentiment as higher mortgage rates weigh on affordability.
- The weekly MBA Mortgage Application Index declined for a third straight week to -3.7% from the prior week’s -1.2% decline. The Refinance Index fell -7.8% from last week and the Purchase Index was down -1.8% for the week. The decline came as the average 30-year mortgage rate rose 15 basis points to 5.80% and is up +2.77 percentage points from last year.
- The Labor Department’s Job Openings and Labor Turnover Survey (JOLTS) report, a measure of unmet demand for labor, increased solidly to 11.2 million jobs available to be filled in July, well ahead of expectations for 10.4 million jobs, and above June’s upwardly revised 11.0 million. It was the first monthly increase in four months. The report showed the hiring rate was unchanged from June’s 4.2% level, and separations ticked slid to 3.9% from June’s 4.0% rate. The quit rate for July was 2.7%, slightly below June’s 2.8% pace.
- Weekly Initial Jobless Claims were 232,000 for the week ended August 27, under expectations of 248,000, and down from the prior week’s downwardly revised 237,000. Continuing Claims for the week ended August 20 rose 26,000 to 1,438,000, matching expectations.
The Week Ahead
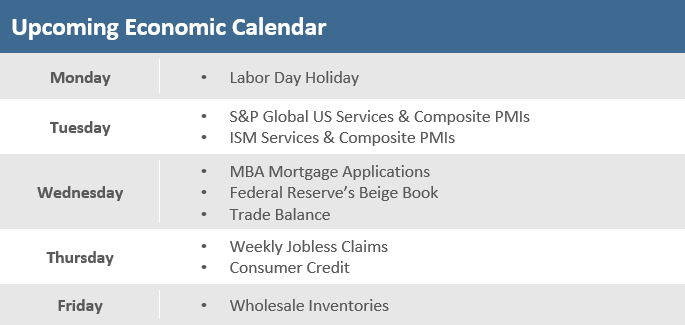
The economic calendar is sparse in the holiday-shortened week and there are only a handful of companies left to report profits in the 2Q-2022 earnings season. As a result, Fed speakers and central bank meetings may command the headlines. The economic reports of focus will likely be the ISM and S&P Global services PMIs which will provide a look at the key services sector activity. The Fed’s Beige Book report could also garner some scrutiny as Fed officials prepare for their monetary policy decision scheduled for September 21. Like the U.S. Federal Reserve, the Reserve Bank of Australia, European Central Bank (ECB), and the Bank of Canada are all ready to tackle inflation. The ECB is expected to hike rates 75 basis points after recent remarks from members turned more hawkish, although there is still some speculation of a 50-point increase. For Federal Reserve watchers, Cleveland Fed President Loretta Mester speaks on Wednesday, and Jerome Powell will make a notable conference appearance on Thursday. Chicago Fed president Charles Evans and Fed Board of Governors Christopher Waller round out the week with appearances on Friday.
Did You Know?
TIME IN THE MARKET – Over the last 50 years (1972-2021), the S&P 500 has been split 53/47 between “up” and “down” trading days, but despite the near “every-other-day” back-and-forth volatility, the S&P 500 still generated an average annual return of +11.1% (source: BTN Research).
CAPITULATION? – Investors pulled a net $10.6 billion out of equity mutual funds and ETFs in the week ended Wednesday, August 31, according to Refinitiv Lipper. That was the largest weekly outflow since the period ending June 15—the day before the S&P 500’s lowest close this year (source: The Wall Street Journal, Refinitiv Lipper).
BIRTH OF THE DOLLAR – On September 2 in 1776, a committee led by Thomas Jefferson recommended to the Continental Congress that the U.S. create a basic unit of currency called the “dollar.” The U.S. dollar derived its name from a Spanish and Austrian coin originally called the “thaler” (source: The Wall Street Journal).
This Week in History
PROTECTING RETIREES – On September 2, 1974, U.S. President Gerald Ford signed the Employee Retirement Income Security Act (ERISA), which set minimum standards for private industry retirement and health plans that protect the individuals participating in those plans. The ERISA ultimately opened the door for the creation of 401(k) plans in 1981. Today, 401(k) plans hold an estimated $6.9 trillion in assets and represent nearly 20% of the total U.S. retirement market. There are a total of about 600,000 401(k) plans that have roughly 60 million active participants (source: Benzinga).
Asset Class Performance
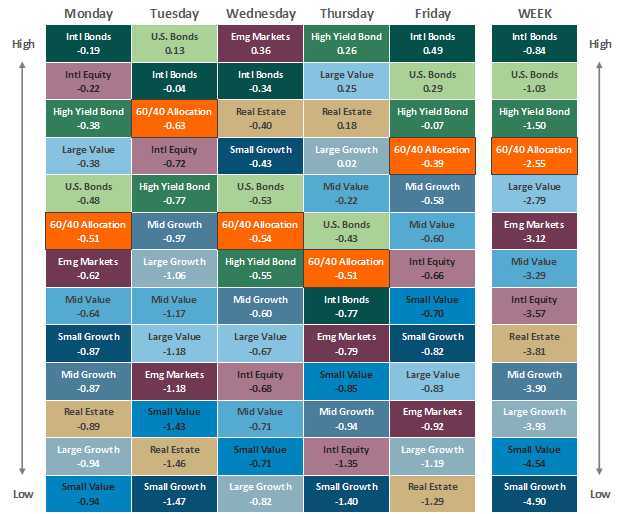
The Importance of Diversification. Diversification mitigates the risk of relying on any single investment and offers a host of long-term benefits, such as lowering portfolio volatility, improving risk-adjusted returns, and helping investments to compound more effectively.
Source: Bloomberg. Asset‐class performance is presented by using market returns from an exchange‐traded fund (ETF) proxy that best represents its respective broad asset class. Returns shown are net of fund fees for and do not necessarily represent the performance of specific mutual funds and/or exchange-traded funds recommended by The Retirement Planning Group. The performance of those funds may be substantially different than the performance of the broad asset classes and to proxy ETFs represented here. U.S. Bonds (iShares Core U.S. Aggregate Bond ETF); High‐Yield Bond (iShares iBoxx $ High Yield Corporate Bond ETF); Intl Bonds (SPDR® Bloomberg Barclays International Corporate Bond ETF); Large Growth (iShares Russell 1000 Growth ETF); Large Value (iShares Russell 1000 Value ETF); Mid Growth (iShares Russell Mid-Cap Growth ETF); Mid Value (iShares Russell Mid-Cap Value ETF); Small Growth (iShares Russell 2000 Growth ETF); Small Value (iShares Russell 2000 Value ETF); Intl Equity (iShares MSCI EAFE ETF); Emg Markets (iShares MSCI Emerging Markets ETF); and Real Estate (iShares U.S. Real Estate ETF). The return displayed as “Allocation” is a weighted average of the ETF proxies shown as represented by: 30% U.S. Bonds, 5% International Bonds, 5% High Yield Bonds, 10% Large Growth, 10% Large Value, 4% Mid Growth, 4% Mid Value, 2% Small Growth, 2% Small Value, 18% International Stock, 7% Emerging Markets, 3% Real Estate.
Chris Bouffard is CIO of The Retirement Planning Group (TRPG), a Registered Investment Adviser. He has oversight of investments for the advisory services offered through TRPG.
Disclaimer: Information provided is for educational purposes only and does not constitute investment, legal or tax advice. All examples are hypothetical and for illustrative purposes only. Past performance of any market results is no assurance of future performance. The information contained herein has been obtained from sources deemed reliable but is not guaranteed. Please contact TRPG for more complete information based on your personal circumstances and to obtain personal individual investment advice.


