Quick Takes
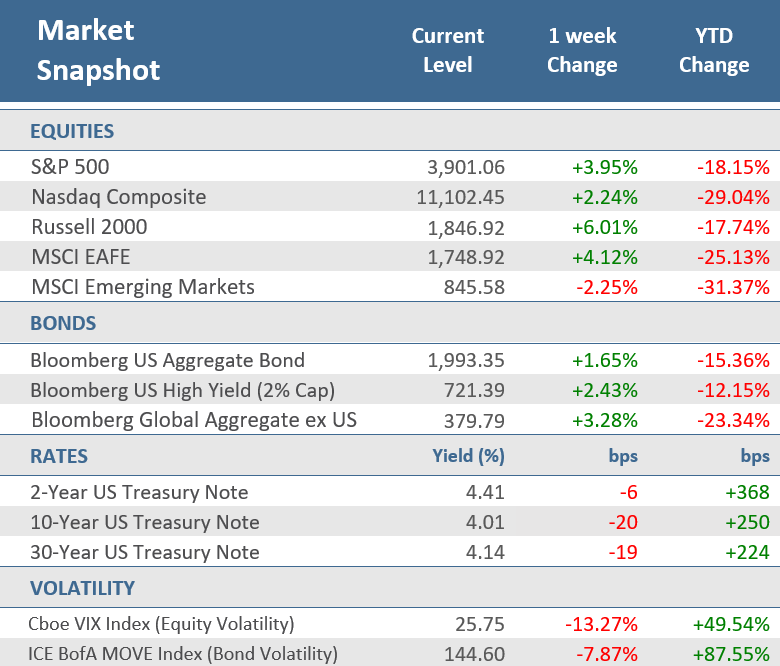
- Stocks sidestepped disappointing earnings news, especially dismal outlooks from big technology firms, and instead focused on a stronger-than-expected GDP report and inflation data that was in check with expectations. The S&P 500 gained +3.9% for the week.
- Bonds also rallied with the U.S. 10-year Treasury yield down 20 basis points, falling back to 4.0%, and ending a 12-week streak of rising yields. The drop in Treasury yields helped the Bloomberg Aggregate U.S. Bond Index to its best weekly return since March 2020 (+1.7%).
- The U.S. economy expanded at a slightly faster pace than expected in the third quarter with GDP growing at a +2.6% annualized pace, breaking the streak of the prior two-quarters of negative GDP.
Stocks ended the week with impressive momentum
Stocks did an admirable job of ignoring disappointing earnings news this past week, especially the sobering outlook from technology firms, and instead focused on a stronger-than-expected GDP report and inflation data that was in check with expectations. The S&P 500 gained +3.9%, the Russell 2000 (small caps) jumped +6.0% and the Nasdaq rose +2.2%. It was the first two-week win streak for those indices since the first two weeks of August. The S&P 500 hit a couple of technical milestones that may help its momentum. During the week the S&P climbed above its 50-day moving average, a widely-watched technical indicator, and then on Friday the index closed above 3,900 points, the first time above that level since September 14. Markets got a boost after the September Core Personal Consumption Expenditures (PCE) Price Index increased +0.5% from the previous month and +5.1% from a year ago. While still high, it was essentially in line with expectations. This is the preferred gauge of inflation for the Federal Reserve.
Bonds also liked the in-line inflation data. The U.S. 10-year Treasury yield dropped 20 basis points, falling back to a tad over 4.0%. That ended a 12-week streak of rising yields for the 10-year. The 2-year Treasury yield fell 6 basis points on the week, but at 4.47% it remains higher than the 10-year. The drop in Treasury yields helped the Bloomberg Aggregate U.S. Bond Index to its best weekly return since March 2020, a gain of +1.7%.
In a busy week for third-quarter earnings, it was a bit of a tech wreck. Shares of the Google parent Alphabet and Microsoft slumped more than -6% after missing earnings expectations, while Amazon sank more than -12% after a mixed report. Meta Platforms (formerly known as Facebook) cratered -20% on Wednesday missing on earnings. If somebody told you those former market darlings have single-day losses that large, it would be very difficult to imagine the market closing positively for the week. In fact, Apple was the only member of the mega cap “Big Tech” cohort that didn’t trade lower after reporting earnings. The continuation of the S&P 500’s rally in light of the magnitude of those earnings misses is especially impressive. Overall, FactSet data shows that the S&P 500 is reporting year-over-year earnings growth of +2.2% for Q3-2022, which is the lowest growth since Q3-2020 (-5.7%), which may challenge the market’s momentum.
Chart of the Week
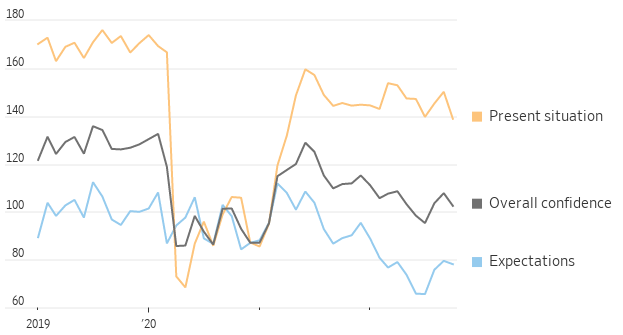
The Conference Board’s Consumer Confidence Index slipped in October as households worried about high inflation and the labor market, the first decline in three months. Consumer confidence tends to project household spending, a major driver of the U.S. economy. October Consumer Confidence decreased to 102.5 from a downwardly revised 107.8 in September, and well below expectations for 106. The Expectations Index of business conditions for the next six months portion of the index decreased to 78.1 from September’s downwardly revised 79.5 level. A reading below 80 for the Expectations Index suggests recession risk appears to be rising. The Present Situation Index portion of the survey decreased to 138.9 from the previous month’s upwardly revised 150.2 level. Lynn Franco, Senior Director of Economic Indicators at The Conference Board, stated, “Consumer confidence retreated in October, after advancing in August and September. The Present Situation Index fell sharply, suggesting economic growth slowed to the start of Q4. Consumers’ expectations regarding the short-term outlook remained dismal.”
Confidence Slips
U.S. consumer confidence index
Note: Seasonally adjusted; 1985=100
Source: The Conference Board, The Wall Street Journal.
Economic Review
- The first estimate (of three) for Q3 Gross Domestic Product (GDP) was an annualized +2.6% for the quarter, beating expectations for a +2.4% gain after the unrevised -0.6% contraction in Q2. Personal Consumption rose by +1.4%, above the expected +1.0%, but down from the unadjusted +2.0% increase recorded in Q2. The Bureau of Economic Analysis said the increase in GDP reflected increases in exports, consumer spending, nonresidential fixed investment, and government spending (federal, state, and local), which were partly offset by decreases in residential fixed investment, and private inventory investment. Imports, which are a subtraction in the calculation of GDP, decreased. On inflation, the GDP Price Index came in at a +4.1% increase, below expectations of + 5.3% and well below the unrevised +9.0% rise in Q2, while the Core PCE Price Index, which excludes food and energy, moved +4.5% higher, in line with expectations, and down from the unadjusted +4.7% increase in Q2.
- The September Chicago Fed National Activity Index (CFNAI) held steady at 0.10 from August (which was revised up from 0.00). The CFNAI is a weighted average of 85 monthly indicators of national economic activity. Positive readings correspond to growth above the trend and negative readings correspond to growth below the trend. Over the last 10 years, there has been a 79% correlation between the change in the CFNAI and quarterly growth in real GDP.
- The preliminary S&P Global Composite US Purchase Managers Indices (PMIs) for October, which includes services and manufacturing activity, fell to 47.3 from 49.5 in September, its second-fastest pace of decline since 2009 excluding early 2020 at the start of the pandemic. Levels below 50 signal contracting economic activity while levels above 50 signal growth. The S&P Global U.S. Manufacturing PMI component unexpectedly fell into contraction territory, dropping to 49.9 from September’s unrevised 52.0, well behind expectations for a decline to 51.0. The preliminary S&P Global U.S. Services PMI Index also fell below expectations of 49.35 and September’s 49.3, sinking to 46.6.
- The Richmond Fed Manufacturing Activity Index was weaker than expected in October, falling to -10, well below the expected -5 and September’s 0 level. A reading of 0 is the demarcation point between expansion and contraction. New order volumes, capacity utilization, vendor lead time, the backlog of new orders, and local business conditions all declined further into contraction territory, while capital expenditures and wages also declined, but remained expansionary.
- The October Kansas City Fed Manufacturing Activity Index fell more than expected and into contraction territory (a reading below zero), dropping to -7 from September’s unrevised 1 reading, and worse than expectations for a decrease to -2.
- Preliminary Durable Goods Orders rose +0.4% for September, below expectations for +0.6%, but above August’s upwardly revised +0.2%. Orders Excluding Transportation, fell -0.5% from August’s downwardly revised flat level and below expectations for +0.2%. Finally, Nondefense Capital Goods Orders Excluding Aircraft—considered a proxy for capital spending—fell -0.7%, well below the expected +0.3%, and August’s downwardly revised +0.8%.
- Personal Income rose +0.4% in September, matching expectations and August’s upwardly revised level. Personal Spending increased +0.6%, above expectations for +0.4%, and the prior month’s upwardly revised +0.4% gain. The August savings rate as a percentage of disposable income was 3.1%, below August’s unrevised 3.5% rate.
- The final University of Michigan Consumer Sentiment Index for October was revised higher to 59.9, from the preliminary 59.8 figure, higher than the expected dip to 59.6. The upward revision came as the Current Conditions component of the survey was revised modestly higher from the preliminary estimate, while the Expectations component of the survey was flat. The 1-year inflation forecast was adjusted lower to 5.0% from the preliminary estimate of 5.1%, where it was expected to remain, which is up from September’s 4.7% rate. The 5-10 year inflation forecast was unchanged from the preliminary read of 2.9%, matching forecasts, and above September’s 2.7% rate.
- The August S&P CoreLogic Case-Shiller National Home Price Index fell -1.1% from July, the biggest decline since 2011. From a year ago, prices are up +13%, a slowdown from the +15.6% year-over-year rise in July. Economists expect home price growth to continue to decelerate.
- September New Home Sales fell -10.9% for the month to an annual rate of 603,000 units, which beat expectations for a rate of 580,000 units but was down from August’s downwardly revised 677,000-unit level. The Median Home Price rose +13.9% from a year ago to $470,600. New Home Inventory rose to 9.2 months from August’s level of 8.1 months of supply at the current sales pace. Sales fell for the month in the South and the West but were sharply higher in the Northeast and rose in the Midwest. Year-over-year, sales in the Northeast and Midwest were higher but were down in the South and West.
- September Pending Home Sales dropped -10.2%, far more than the expected -4.0% decline and August’s upwardly revised -1.9% decline. Sales plunged -31.0% year-over-year on the heels of August’s negatively revised -24.1% drop.
- The weekly MBA Mortgage Application Index fell -1.7% from the prior week’s -4.5% decline. It was the fifth straight weekly decline as the Refinance Index was flat from last week and the Purchase Index was down -2.3% for the week. The decrease came as the average 30-year mortgage rate rose 22 basis points to 7.16%, which is up +3.86 percentage points higher than last year.
- Weekly Initial Jobless Claims were 217,000 for the week ended October 22, under expectations for 220,000 and the prior week’s unrevised 214,000. Continuing Claims for the week ended October 15 rose by 55,000 to 1,438,000, higher than expectations of 1,390,000.
The Week Ahead
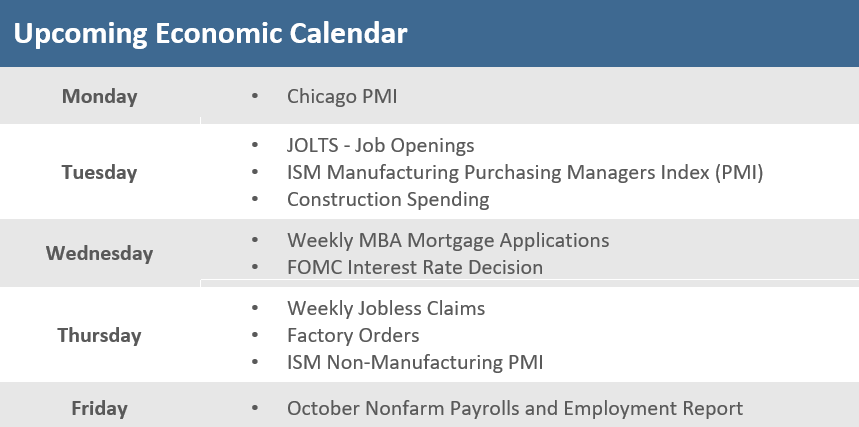
The Federal Reserve’s meeting Tuesday and Wednesday will be the key focus in the week ahead, and the outcome may heavily influence how markets trade the rest of the year. The Fed is expected to raise the fed funds rate by 75 basis points (three-quarters of a percentage point), but there is some expectation that Fed Chairman Jerome Powell may signal that the Fed is considering paring back the size of future rate hikes. Any such suggestion will likely fuel the rally further. Besides the Fed’s rate decision, there is a bevy of economic reports on tap. The labor market will get some attention with JOLTS job openings, weekly jobless claims, and then Friday’s October employment report. Factory Orders are on the docket as well as the ISM manufacturing and services PMIs. It is also a very busy week for earnings, with about a third of S&P 500 companies reporting.
Did You Know?
SHOULD I STAY OR SHOULD I GO – Only 18% of plan participants expect to leave their retirement savings in their former employer’s plan when they retire, but 54% of plan sponsors would prefer to keep participant assets in the plan after they retire (source: MFS 2021 Global Retirement Survey, Cerulli Report: US Retirement Markets 2021).
THROUGH THE ROOF – U.S. mortgage rates topped 7% for the first time in 20 years. The rate on a 30-year fixed mortgage averaged 7.08% for the week. A year ago, it was just over 3%. Rapidly rising borrowing costs caused by the Fed’s rate increases have deterred many homebuyers, prolonging the housing market’s hurdles (source: The Wall Street Journal).
BIG COLA – The annual increase applied to Social Security retirement benefits as of 1/01/2023 is based on “Consumer Price Index” inflation over the 12 months ending 9/30/2022. Inflation over the 9 months from 10/01/2021 through 6/30/2022 has been reported and is +8.7%. The Social Security “cost-of-living” adjustment (COLA) has been at least +10% just twice in history: +14.3% in 1980 and +11.2% in 1981 (source: Department of Labor, MFS).
This Week in History
THE ORIGINAL INSTANT MESSAGING – On Monday, October 24 in 1861, the first transcontinental telegraph line was activated, enabling messages to be transmitted almost instantly from New York to California. News that would have taken two or three months to go from coast to coast just 10 years earlier could travel the distance in two or three minutes (source: The Wall Street Journal).
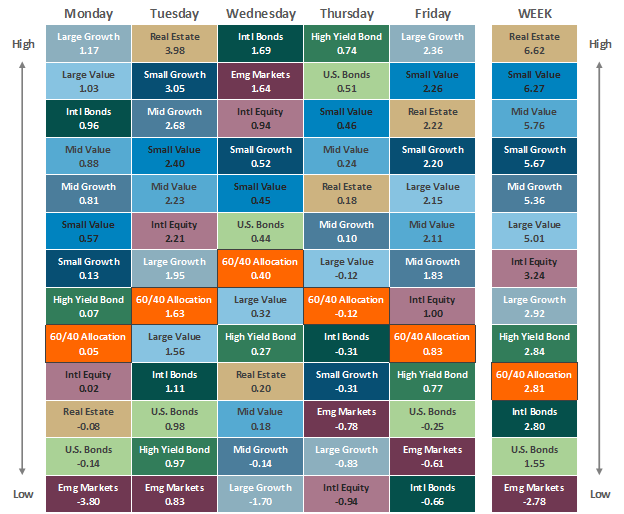
Asset Class Performance
The Importance of Diversification. Diversification mitigates the risk of relying on any single investment and offers a host of long-term benefits, such as lowering portfolio volatility, improving risk-adjusted returns, and helping investments to compound more effectively.
Source: Bloomberg.
Asset‐class performance is presented by using market returns from an exchange‐traded fund (ETF) proxy that best represents its respective broad asset class. Returns shown are net of fund fees for and do not necessarily represent performance of specific mutual funds and/or exchange-traded funds recommended by The Retirement Planning Group. The performance of those funds may be substantially different than the performance of the broad asset classes and to proxy ETFs represented here. U.S. Bonds (iShares Core U.S. Aggregate Bond ETF); High‐Yield Bond (iShares iBoxx $ High Yield Corporate Bond ETF); Intl Bonds (SPDR® Bloomberg Barclays International Corporate Bond ETF); Large Growth (iShares Russell 1000 Growth ETF); Large Value (iShares Russell 1000 Value ETF); Mid Growth (iShares Russell Mid-Cap Growth ETF); Mid Value (iShares Russell Mid-Cap Value ETF); Small Growth (iShares Russell 2000 Growth ETF); Small Value (iShares Russell 2000 Value ETF); Intl Equity (iShares MSCI EAFE ETF); Emg Markets (iShares MSCI Emerging Markets ETF); and Real Estate (iShares U.S. Real Estate ETF). The return displayed as “Allocation” is a weighted average of the ETF proxies shown as represented by: 30% U.S. Bonds, 5% International Bonds, 5% High Yield Bonds, 10% Large Growth, 10% Large Value, 4% Mid Growth, 4% Mid Value, 2% Small Growth, 2% Small Value, 18% International Stock, 7% Emerging Markets, 3% Real Estate.
* The term basis points (bps) refers to a common unit of measure for interest rates and other percentages in finance. One basis point is equal to 0.01%. Bond prices and bond yields are inversely related. As the price of a bond goes up, the yield decreases.


