Quick Takes
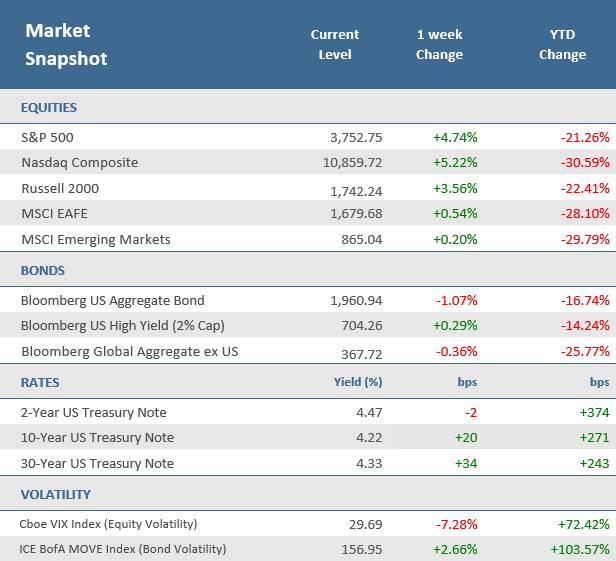
- Markets continued their roller coaster action, but this week they managed to close higher after being down four of the five prior weeks. In fact, it was the best week for stocks since June, with the S&P 500 advancing +4.7% and the Nasdaq up +5.2%.
- The first major week of earnings season for the third quarter delivered a mixed picture of corporate profits. About 20% of the S&P 500 have reported earnings, and 72% have beat estimates by about +2.3%. That’s a bit below the average beat rate but higher growth than expected.
- Economic data was mixed for the week. U.S. Existing Home Sales fell for an eighth straight month in September, the longest streak of declines in 15 years. But Industrial Production and Capacity Utilization both beat expectations.
Stocks scored their biggest weekly percentage gains since June
Investors weighed a multitude of earnings and economic reports during the week, but it was remarks by Federal Reserve officials that caused some of the biggest moves in markets. The S&P 500 gained +4.7%, the Russell 2000 (small caps) was up +3.6% and the Nasdaq rose +5.2%. It was the best week since June for the S&P and Nasdaq. The stock rally came despite a surge in Treasury yields. The U.S. 10-year Treasury yield jumped to its highest level since 2008 before reversing on Friday. After touching a high of 4.33%, the 10-year closed at 4.22%. The 2-year Treasury yield fell 2 basis points on the week, but at 4.47% it remains higher than the 10-year.
The first major week of earnings season for the third quarter delivered a mixed picture of corporate profits. Overall, earnings growth has slowed this quarter, but it appears they may remain positive and future guidance hasn’t been as bad as many feared. As of Friday, 99 companies in the S&P 500 have reported earnings, with 72% of them coming in higher than expected, according to FactSet data. That’s not terrible but investors have grown used to better results. That 72% beat rate is below the 5-year average of 77% and the 10-year average of 73%. Companies are reporting earnings that are +2.3% above estimates, which is also below the 5-year average (+8.7%) and the 10-year average (6.5%). So overall, Q3-2022 earnings are better than feared, but lower than average.
But earnings were only part of the story. The stock market rally struggled midweek in the midst of a number of Fed officials reiterating the need for the Fed’s aggressive stance against inflation (i.e. higher interest rates for longer). The presidents of the Minneapolis Fed and the Philadelphia Fed both expressed hawkish views about interest rates needing to be well above 4%. But on Friday, the president of the San Francisco Fed stoked stocks with dovish comments, saying she thinks slowing down the pace of rate hikes may be needed to stabilize market structure. In addition, The Wall Street Journal published an article Friday that indicated the Fed will raise rates by another 75 basis points at the November meeting but will then possibly consider a smaller increase at the December meeting. The Fed will be in a quiet period this week ahead of their rate setting meeting the following week, so markets should be more focused on earnings and economic data.
Chart of the Week
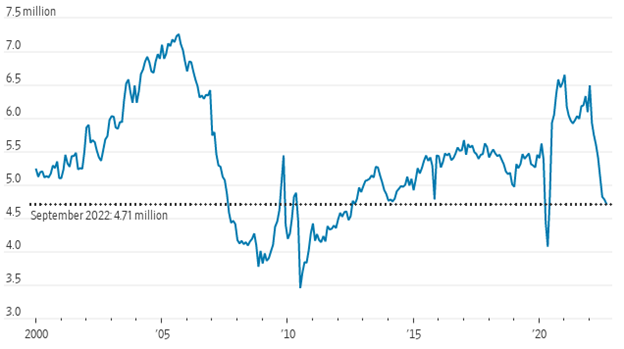
U.S. Existing Home Sales fell for an eighth straight month in September, the longest streak of declines in 15 years. Sales fell -1.5% to an annual rate of 4.71 million units, better than expectations for a -2.1% decrease to a 4.70 million-unit pace. August was revised lower to 4.78 million units. Sales are down -23.8% from a year ago and remain at the lowest level since May 2020. September sales across the four major regions were lower, except of the West which was flat. The Median Existing Home Price was up +8.4% from a year ago at $384,800—marking the 127th straight month of year-over-year gains—but it was the third month in a row that the median sales price decelerated from the record high of $413,800 in June. The number of homes for sale declined for a second month after five successive monthly increases, and it would take 3.2 months to sell all the houses on the market, up from the 2.4 months pace in the same period last year.
Home Sales Drop for Eighth Straight Month
U.S. existing-home sales
Source: National Association of Realtors, The Wall Street Journal.
Economic Review
- September Industrial Production and Capacity Utilization beat expectations. The Federal Reserve reported that Industrial Production was up +0.4% for the month, above estimates for a +0.1% increase and an upwardly revised -0.1% decline in August. Manufacturing output was +0.4% higher, mining output up +0.6%, and utilities consumption down -0.3%. Capacity Utilization rose to 80.3%, north of estimates for a decline to 80.0% and the prior month’s upwardly revised 80.1%.
- The National Association of Home Builders (NAHB) Housing Market Index (HMI) showed homebuilder confidence sank in October to 38 from September’s unrevised 46 level, down much more than the expected decline to 43. It was the third-straight month that homebuilder sentiment was below 50—which suggests poor conditions—and has declined for ten-straight months. The poor results comes as the backdrop of rising interest rates and elevated home prices have caused affordability to plummet.
- Housing Starts fell -8.1% for the month of September to an annual pace of 1,439,000 units, -7.1% decline to a 1,462,000-unit pace, and well under August’s downwardly revised 1,566,000 units. Building Permits, one of the leading indicators tracked by the Conference Board as it is a gauge of future construction, rose +1.4% for the month to an annual rate of 1,564,000, beating expectations for a -0.8% decline to 1,530,000 units, and above the upwardly revised 1,542,000-unit pace posted in August.
- The Conference Board’s Leading Economic Index (LEI) fell -0.4% in September, more than the expected -0.3% decline, and upwardly revised flat reading for August. The LEIs have now been negative in six of the last seven months.
- The Federal Reserve’s Beige Book—an anecdotal read on national business activity used by policymakers to prepare for their next monetary policy decision that is set to come during the next FOMC meeting on November 2—showed that economic activity expanded “modestly” in September, but conditions varied across industries and Districts. According to the Fed “Four Districts noted flat activity and two cited declines, with slowing or weak demand attributed to higher interest rates, inflation, and supply disruptions.” Analysis from Renaissance Macro shows that iterations of the words “weak” or “slow” showed up 117 times, up from 103 times in the last Beige Book, and the most since October 2016.
- The October Philly Fed Manufacturing Business Outlook Index remained in contraction territory (below zero) but did edge up to -8.7 from -9.9 in September. Expectations were for an increase to -5.0.
- The October Empire Manufacturing Index, a measure of activity in the New York region, declined more than expected, moving further into contraction territory (a reading below zero). The index fell to -9.0, well behind expectations for a decline to a level of -4.3, and the -1.5 drop in September.
- The weekly MBA Mortgage Application Index fell -4.5% from the prior week’s -1.8% decline. It was the fourth straight weekly decline as the Refinance Index plunged -6.8% from last week and the Purchase Index was down -3.7% for the week. The decrease came as the average 30-year mortgage rate rose 13 basis points to 6.94%, which is its highest level since 2002 and +3.76 percentage points higher than last year.
- Weekly Initial Jobless Claims were 214,000 for the week ended October 15, under expectations for 225,000 and the prior week’s downwardly revised 224,000 (originally 228,000). Continuing Claims for the week ended October 8 rose by 21,000 to 1,385,000, higher than expectations of 1,365,000.
The Week Ahead
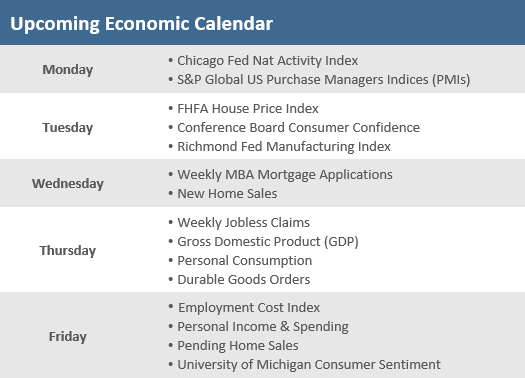
Economic data for the upcoming week is still light but highlights include preliminary S&P Global Manufacturing and Services Purchasing Managers’ Indexes (PMIs) and the Bureau of Economic Analysis’ Personal Income and Spending data for September. The Bureau of Economic Analysis publishes its advance estimate of third-quarter Gross Domestic Product. Economists are expecting a seasonally adjusted annual growth rate of +1.7%, following declines of -1.6% and -0.6% in the first two quarters of 2022. Earnings reports will be pouring in during the week with more than 150 S&P 500 companies scheduled to report including reports from tech-heavyweights Apple, Amazon, and Microsoft.
Did You Know?
ALL IN THE FAMILY – One political party has controlled the White House, the Senate and the House of Representatives in 24 of the last 65 years (37% of the time, i.e., 1958-2022). Republicans last controlled the White House, the Senate and the House in 2018. Democrats control all 3 this year (source: BTN Research).
GRAD STANDARDS – 88% of adults polled think a semester-or year-long personal finance course should be required for high school graduation. Spending and budgeting were the most important topic areas selected for this type of education, followed by managing credit, saving, earning income, investing, and managing risk (source: National Endowment for Financial Education).
WORK FROM HOME, START A BUSINESS – Americans filed 4.35 million “new business” applications in 2020 and 5.36 million in 2021, surpassing the previous U.S. record high of 3.50 million filed in 2019. Before 2017, “new business” applications in the U.S. had not exceeded 3 million in a single year (source: Census Bureau, MFS).
This Week in History
BLACK MONDAY –Historically, September has been the worst performing calendar month of the year. But October has had its share of scary declines. Since 1896, of the 10 largest daily percentage declines in the Dow Jones Industrial Average, four have come in October. That includes the single worst daily percentage decline in history, which occurred 35 years ago on Monday, October 19, 1987, when the Dow plunged -22.6%. Investors were already on edge as the Dow had dropped -3.8%, -2.4%, and -4.6% in three days preceding “Black Monday”. The previous largest one-day decline was a -20.5% on December 14, 1914, when the Dow began trading after being halted for nearly five months due to World War I. Five of the 10 largest daily declines came in the great depression era between 1929 and 1932, which included three of the October incidences, including back-to-back daily declines of -13.5% and -11.7% on October 28 and 29 in 1929. The ninth worst daily decline (-9.9%) came barely a week later on November 6, 1929 (source: Carson Investment Research, FactSet).
Asset Class Performance
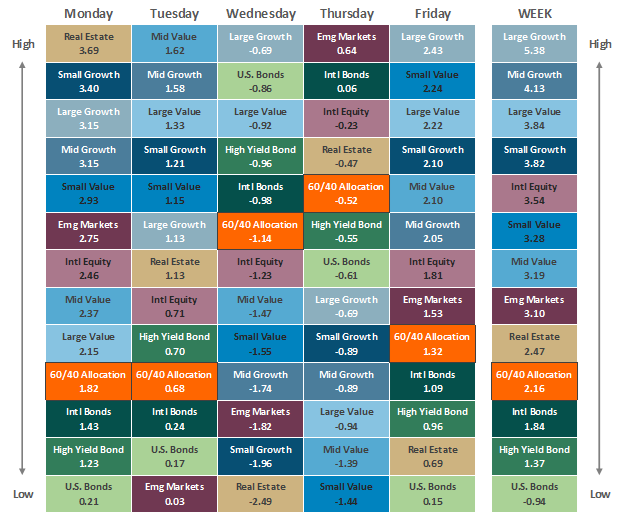
The Importance of Diversification. Diversification mitigates the risk of relying on any single investment and offers a host of long-term benefits, such as lowering portfolio volatility, improving risk-adjusted returns, and helping investments to compound more effectively.
Source: Bloomberg.
Asset‐class performance is presented by using market returns from an exchange‐traded fund (ETF) proxy that best represents its respective broad asset class. Returns shown are net of fund fees for and do not necessarily represent performance of specific mutual funds and/or exchange-traded funds recommended by The Retirement Planning Group. The performance of those funds may be substantially different than the performance of the broad asset classes and to proxy ETFs represented here. U.S. Bonds (iShares Core U.S. Aggregate Bond ETF); High‐Yield Bond (iShares iBoxx $ High Yield Corporate Bond ETF); Intl Bonds (SPDR® Bloomberg Barclays International Corporate Bond ETF); Large Growth (iShares Russell 1000 Growth ETF); Large Value (iShares Russell 1000 Value ETF); Mid Growth (iShares Russell Mid-Cap Growth ETF); Mid Value (iShares Russell Mid-Cap Value ETF); Small Growth (iShares Russell 2000 Growth ETF); Small Value (iShares Russell 2000 Value ETF); Intl Equity (iShares MSCI EAFE ETF); Emg Markets (iShares MSCI Emerging Markets ETF); and Real Estate (iShares U.S. Real Estate ETF). The return displayed as “Allocation” is a weighted average of the ETF proxies shown as represented by: 30% U.S. Bonds, 5% International Bonds, 5% High Yield Bonds, 10% Large Growth, 10% Large Value, 4% Mid Growth, 4% Mid Value, 2% Small Growth, 2% Small Value, 18% International Stock, 7% Emerging Markets, 3% Real Estate.
* The term basis points (bps) refers to a common unit of measure for interest rates and other percentages in finance. One basis point is equal to 0.01%. Bond prices and bond yields are inversely related. As the price of a bond goes up, the yield decreases.


