Quick Takes
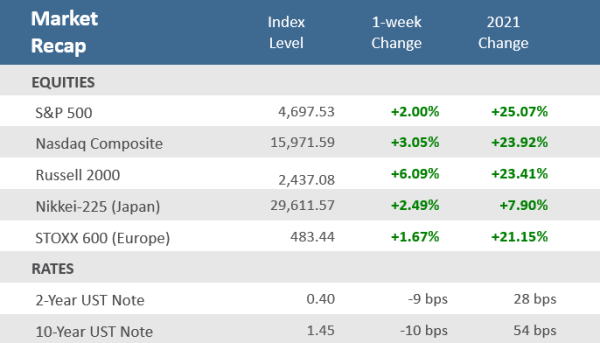
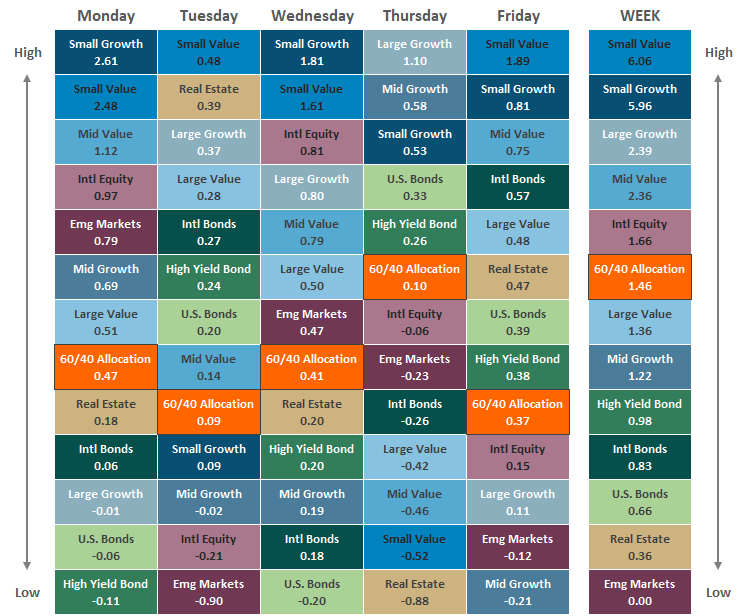
- November started where October ended, with strong stock returns and new record highs. Since June, it was the best week for the S&P 500 Index, and all major U.S. equity indices closed the week at all-time highs. Small-cap stocks led the way with a +6.1% one-week gain, its biggest weekly advance since March.
- The yield on the U.S. 10-year Treasury fell for the second straight week, dropping ten basis points, its most significant weekly decline since June. Unlike last week, this week, the yield on the U.S. 2-year Treasury note also fell with the 10-year yield, dropping nine basis points — its biggest weekly decline since March 2020.
- Economic reports largely beat economists’ expectations and were highlighted by stellar labor market results with the October nonfarm payrolls adding 531,000, the unemployment rate dropping to a new pandemic low of 4.6%, and weekly unemployment claims also dropping to a post-pandemic low.
Stocks Remain at Records with Patient Fed and Strong Hiring
November started on solid footing as stocks marched higher, and bond yields fell in the wake of a strong October employment report. It was the best week for the S&P 500 since the week ending June 25. The S&P 500, the Dow Jones Industrial Average, the Nasdaq Composite, and the Russell 2000 all closed the week at all-time highs. Investors were pleased with economic and earnings reports that continue to be better-than-expected, a Federal Reserve that remains patient on rate hikes, and a promising COVID-19 pill that reduced hospitalizations and deaths in a clinical trial. On Wednesday, the Federal Open Markets Committee (FOMC) announced their plans to taper asset purchases by $15 billion starting this month. Still, at the same time, Federal Reserve Chairman Jerome Powell made it clear that the central bank is in no rush to raise rates. The Fed said it expects to complete the asset purchases by the middle of 2022 and didn’t expect to begin hiking rates until after that. The October employment report was much stronger than expected, with 531,000 new nonfarm payrolls added and a 4.6% unemployment rate, which is the lowest level since the start of the pandemic. Likewise, the weekly initial jobless claims fell to a new pandemic low of 269,000, the sixth straight weekly decline and fourth consecutive week under the 300,000 level. The ISM U.S. Purchasing Managers’ Index (a proxy for businesses activity), also rose to a record high in October, led by a surge in the services sector of the economy. The dovish fed also buoyed bonds as the benchmark 10-year US Treasury note decreased to 1.45% from 1.55%. In the end, no major asset classes declined during the week.
Chart of the Week
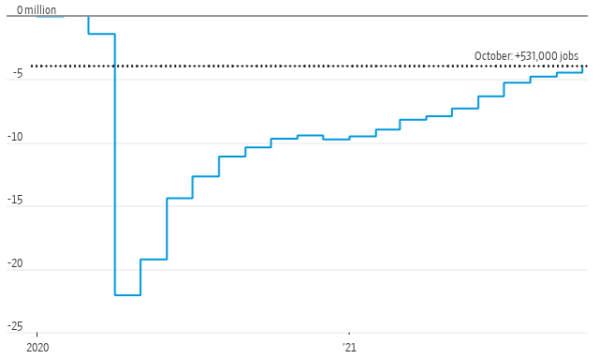
U.S. employment rebounded strongly in October from September’s disappointing results. The Labor Department reported on that Friday U.S. employers added 531,000 new jobs in October, the biggest gain in three months. That was above expectations for 450,000 new jobs, and well ahead of September’s measly 194,000. The unemployment rate also came in better than expected, dropping to 4.6% from 4.8% in September and versus forecasts for 4.7%. The one disappointment was the lack of improvement in the participation rate that remains stubbornly below pre-pandemic levels at 61.6%, unchanged from last month. Economists had expected participation to tick up to 61.7%. As shown in the Chart of the Week, the U.S. still has four million fewer jobs than in February 2020, the month before the pandemic shut down the country. Nonetheless, the October jobs report shows the economy is making progress toward the Federal Reserve’s goal of maximum employment.
Strong Rebound in U.S. Jobs
Payrolls, changes since January 2020
Source: US. Labor Department, The Wall Street Journal. Note: Seasonally adjusted.
Economic Review
- The October Institute for Supply Management (ISM) Manufacturing Purchasing Managers Index (PMI) decelerated slower than expected, falling to 60.8 from 61.1 in September and just ahead of expectations for a decrease to 60.5. Growth in employment and inventories both accelerated, and production growth held steady just below the 60 mark. New orders continued to grow but fell below the 60 mark for the first time since June 2020. The ISM Services PMI unexpectedly jumped to a record high of 66.7 from 61.9 in September and estimates of a rise to 62.0. Prices paid continued to rise sharply, crossing 80 for the second-highest reading ever.
- The final October Markit U.S. Manufacturing PMI Index was unexpectedly revised lower to 58.4 from the preliminary 59.2 level and below September’s reading of 60.7 (above 50 denotes expansion). Markit’s PMI is similar to ISM’s but surveys a broader range of companies in size, and it weighs its components differently. The final Markit U.S. Services PMI was revised slightly higher to 58.7 from the preliminary estimate of 58.2 and up from 54.9 in September.
- Construction Spending declined -0.5 in September versus an upwardly revised +0.1% rise in August and forecasts a +0.3% gain. Residential spending decreased 0.4% m/m, and non-residential spending declined 0.6%.
- October’s final reading of the Vehicle Sales ticked up to an annualized rate of 13 million, up from 12.2 million in September and better than the expected 12.5 million.
- The ADP Employment Change report showed that U.S companies added 571,000 jobs in October, well ahead of estimates for 395,000 and up from the downwardly revised 523,000 in September. Leisure and hospitality were the most significant contributors, with 185,000 new jobs.
- The Federal Open Market Committee (FOMC) concluded its two-day monetary policy meeting. Chairman Powell indicated the Fed is in no hurry to raise rates but did outline the scope of the taper of asset purchases starting this month. The plans are to decrease the pace of their purchases of Treasurys by $10B/month and agency mortgage-backed securities by $5B/month and to end these purchases altogether by the middle of next year. Powell tempered the notion of a liftoff of rates soon after the completion of its tapering, saying that the employment metric for such a move has not been fully met, as the labor market has not fully recovered and remains very tight.
- Weekly unemployment claims fell to 269,000, the lowest pandemic-era total, and better than estimates of 275,000 and last week’s upwardly revised 283,000 level. Continuing claims fell by 134,000 to 2,105,000, below estimates of 2,150,000.
The Week Ahead
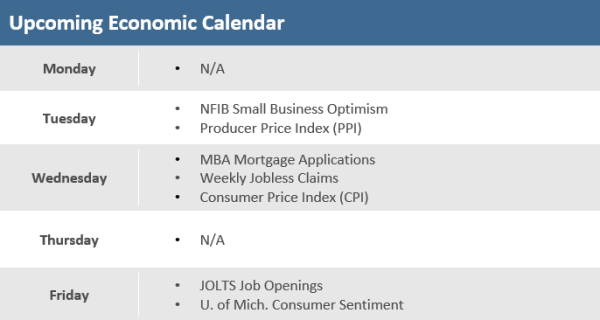
Economic reports will be light this week but inflation data for producers and consumers will be in focus. There are a number of Fed speakers on the calendar, including Fed Chairman Jerome Powell on Monday and Tuesday as well as Fed Vice Chairman Richard Clarida, Minneapolis Fed President Neel Kashkari, New York Fed President John Williams and San Francisco Fed President Mary Daly. The bond market closed Thursday in observance of Veterans Day.
Did You Know?
MILESTONE FOR MILESTONES — On Tuesday, the Dow Jones Industrial Average notched its sixth 1,000-point milestone of the year, the most in a single year on record when it rose +0.4% to close above 36,000. In January, the Dow closed above 31,000 for the first time. It took nearly four years for the Dow to move the last 10,000 points. But the first 5,000 points, from 26,000 to 31,000, took three years while it took under ten months for the second 5,000 points from 31,000 to above 36,000 on Tuesday’s close. And the Dow wasn’t the only index crossing new milestones this week. The S&P 500 crossed above 4,700 for the first time, and the Nasdaq Composite hit 16,000. (Source: The Wall Street Journal, Bloomberg).
FUTURES FRONTRUNNING FED — Interest-rate futures now imply about a 75% chance that the Federal Reserve will raise rates by at least a half percentage point next year, and a better than 40% chance that it will raise them by at least three-quarters of a point. That is more hawkish than Fed Chairman Jerome Powell indicates as he played down the prospect of an imminent turn to raising interest rates at Wednesday’s post FOMC press conference (Source: The Wall Street Journal).
BUY-BACK BETTER — Over the last 20 years, the blue-chip company IBM has repurchased $132 billion of its stock, more than its current market cap of $113 billion. By comparison, Apple has repurchased $435 billion in stock over the past eight years, which is greater than the market cap of 490 companies in the S&P 500. Apple’s market cap is $2,482 billion (source: Compound Capital, Bloomberg).
This Week in History
This week in 1999, just over nine months after breaking the 2,500 price level for the first time, the Nasdaq Composite Index rose 46.88 points to break the 3,000 barrier, closing at 3028.51 on its fourth-highest volume yet on record, 1.33 billion shares. (source: The Wall Street Journal).
Asset Class Performance
The Importance of Diversification. Diversification mitigates the risk of relying on any single investment and offers a host of long-term benefits, such as lowering portfolio volatility, improving risk-adjusted returns, and helping investments to compound more effectively.
Source: Bloomberg. Asset‐class performance is presented by using market returns from an exchange‐traded fund (ETF) proxy that best represents its respective broad asset class. Returns shown are net of fund fees for and do not necessarily represent the performance of specific mutual funds and/or exchange-traded funds recommended by The Retirement Planning Group. The performance of those funds may be substantially different than the performance of the broad asset classes and to proxy ETFs represented here. U.S. Bonds (iShares Core U.S. Aggregate Bond ETF); High‐Yield Bond (iShares iBoxx $ High Yield Corporate Bond ETF); Intl Bonds (SPDR® Bloomberg Barclays International Corporate Bond ETF); Large Growth (iShares Russell 1000 Growth ETF); Large Value (iShares Russell 1000 Value ETF); Mid Growth (iShares Russell Mid-Cap Growth ETF); Mid Value (iShares Russell Mid-Cap Value ETF); Small Growth (iShares Russell 2000 Growth ETF); Small Value (iShares Russell 2000 Value ETF); Intl Equity (iShares MSCI EAFE ETF); Emg Markets (iShares MSCI Emerging Markets ETF); and Real Estate (iShares U.S. Real Estate ETF). The return displayed as “Allocation” is a weighted average of the ETF proxies shown as represented by: 30% U.S. Bonds, 5% International Bonds, 5% High Yield Bonds, 10% Large Growth, 10% Large Value, 4% Mid Growth, 4% Mid Value, 2% Small Growth, 2% Small Value, 18% International Stock, 7% Emerging Markets, 3% Real Estate.
Chris Bouffard is CIO of The Retirement Planning Group (TRPG), a Registered Investment Adviser. He has oversight of investments for the advisory services offered through TRPG.
Disclaimer: Information provided is for educational purposes only and does not constitute investment, legal or tax advice. All examples are hypothetical and for illustrative purposes only. Past performance of any market results is no assurance of future performance. The information contained herein has been obtained from sources deemed reliable but is not guaranteed. Please contact TRPG for more complete information based on your personal circumstances and to obtain personal individual investment advice.


