Quick Takes
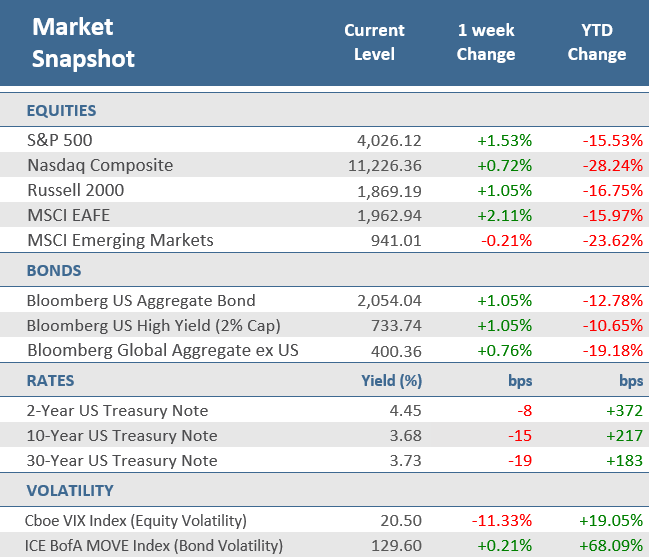
- The main U.S. indexes ended the holiday-shortened week higher as signs that the Fed may slow the pace of future rate hikes gave stocks a boost. The S&P 500 rose +1.5%, the tech-heavy Nasdaq Composite was up +0.7%, and the small cap Russell 2000 added +1.1%.
- The 10-year Treasury yield shed another -15 basis points to end the week at 3.68% and the 2-year yield dropped -8 basis points to finish at 4.45%. The Bloomberg U.S. Aggregate Bond Index gained +1.1% for the week and the Global Aggregate Bond Index ex U.S. was up 0.8%.
- Minutes from the November Federal Open Market Committee meeting showed that Fed officials expect to slow the pace of rate hikes in December. They suggested reducing rate hikes to a 0.5 percentage point hike in December after four 0.75 percentage point hikes.
Stocks and bonds advance in light holiday trading
U.S. stocks and bonds made modest gains in subdued trading during the Thanksgiving holiday-shortened week. The S&P 500 advanced +1.5%, the Nasdaq Composite was up +0.7%, and the Russell 2000 added +1.0%. Gains were broad-based with all 11 S&P 500 sectors positive for the week. Developed market stocks did even better, with the MSCI EAFE Index rising +2.1%. Emerging market stocks, however, were down -0.2% as a record 48 cities in China are currently subject to COVID restrictions.
The 10-year Treasury yield shed another -15 basis points to end the week at 3.68% and the 2-year yield dropped -8 basis points to finish at 4.45%. The Bloomberg U.S. Aggregate Bond Index gained +1.1% for the week and the Global Aggregate Bond Index ex U.S. was up 0.8%.
In a mostly quiet week of economic data, the minutes of the Fed’s November monetary policy meeting were released on Wednesday and showed most Fed officials wanted to slow the pace of interest-rate increases starting next month. They suggested beginning to reduce rate rises to 0.5 percentage point after four increases of 0.75 percentage point. The last meeting brought the Fed’s benchmark rate to a range between 3.75% and 4%. The Fed is hiking rates at the fastest pace since the early 1980s to reduce persistently high inflation. The dovish Fed minutes gave stocks a boost. Other economic data showed that the economy has slowed with economic activity and manufacturing data falling into contraction territory. However, home sales and mortgage applications got a boost from the dip in yields and mortgage rates. Meanwhile, consumer sentiment unexpectedly was revised higher, supporting the case that the U.S. consumer remains resilient.
Chart of the Week
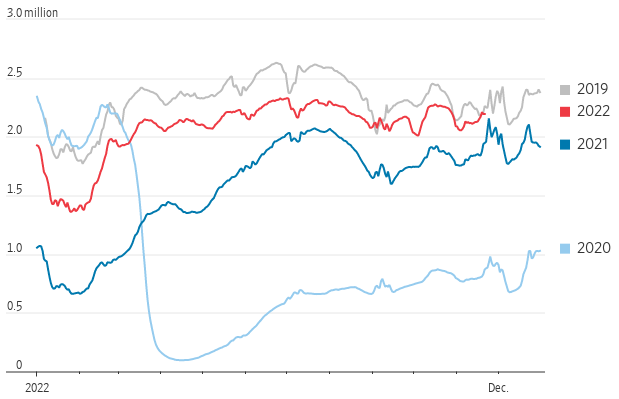
Thanksgiving travel is back to normal, with packed flights and expensive tickets. More than 2 million people a day now routinely pass through U.S. airports, according to the Transportation Security Administration, similar levels to 2019, before the Covid-19 pandemic shut down air travel. The experience at America’s airports is a sign that the pandemic’s direct impact on the economy is mostly in the past, even though we are still dealing with the aftershocks. It’s also an indication that households are willing to spend on travel despite historically high inflation and a slowing economy.
Up in the Air
TSA checkpoint travel numbers
Note: Seven-day moving average
Source: Transportation Security Administration, The Wall Street Journal.
Economic Review
- The preliminary S&P Global U.S. Manufacturing PMI Index for November unexpectedly fell into contraction territory (a reading below 50), dropping to 47.6 from October’s unrevised 50.4, and below expectations for 50.0. The preliminary S&P Global U.S. Services PMI Index unexpectedly fell deeper into contraction, dropping to 46.1, below expectations of 48.0 and October’s 47.8.
- The Chicago Fed National Activity Index, which measures overall economic activity and inflationary pressures, decreased to -0.05 in October from +0.17 in September. The reading suggests U.S. economic activity grew slightly below its average historical trend over the month.
- October preliminary Durable Goods Orders rose +1.0% for the month, above expectations of +0.4%, and the prior month’s downwardly revised +0.3% gain. Nondefense capital goods orders excluding aircraft—considered a proxy for capital spending—increased +0.7%, above expectations for an unchanged reading and the prior month’s downwardly revised -0.8% decline.
- The final University of Michigan Consumer Sentiment Index for November was revised up to 56.8 from the preliminary 54.7, well above expectations of 55.0. The stronger-than-expected upward revision came as both the Current Conditions and Expectations components of the survey were adjusted solidly higher. The 1-Year Inflation Forecast was adjusted lower to 4.9% from the preliminary estimate of 5.1%, where it was expected to remain, and down from October’s 5.0% rate. The 5-10 Year Inflation Forecast was unchanged from the preliminary 3.0%, in line with expectations, and slightly above October’s 2.9%.
- The November Richmond Fed Manufacturing Activity Index improved for the month, nudging up to -9 from -10 in October, in line with expectations, but remaining in contraction territory (below zero). Employment deteriorated slightly, while new order volumes, vendor lead times, and orders backlog showed some improvement but remained negative. Wages and capital expenditures decreased but remained elevated, while shipments and capacity utilization continued to worsen.
- October New Home Sales rose +7.5% for the month to an annual rate of 632,000 units, well above expectations of 570,000 units, and September’s downwardly revised 588,000 units. The Median Home Price rose +15.4% from last year to $493,000. New Home Inventory fell to 8.9 months from September’s 9.4 months of supply. Sales jumped month-over-month in the Northeast and South but fell in the Midwest and dipped in the West. Year-over-year sales in the Northeast were noticeably higher, while down in all other regions compared to last year. New home sales are based on contract signings, offering a timelier read on housing activity compared to the larger contributor of existing home sales, which are based on closings.
- The weekly MBA Mortgage Application Index rose +2.2% from the prior week’s +2.7% rise. It was the second increase in a row as the Refinance Index was up +1.8% from last week and the Purchase Index was up +2.8% for the week. The decrease came as the average 30-year mortgage rate fell 23 bps to 6.67%, which is up 3.43 percentage points versus a year ago.
- Weekly Initial Jobless Claims fell by 17,000 to 240,000 for the week ended November 19, above expectations for 225,000, and the prior week’s upwardly revised 223,000. Continuing Claims for the week ended November 12 rose by 48,000 to 1,520,000, higher than expectations of 1,520,000.
The Week Ahead
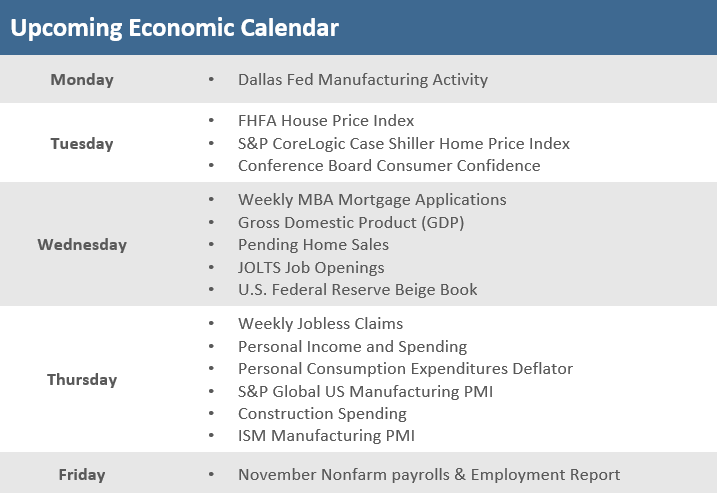
The third quarter earnings reporting season is essentially over so economic reports will be back to being in the spotlight for more attention, with a fairly full schedule after the prior week’s light holiday shortened calendar. Among the anticipated reports are the Conference Board’s Consumer Confidence Index and personal income and spending for a look at consumers’ psyche ahead of the holiday season. The first revision (of two) for third quarter GDP comes midweek, as well as some U.S. manufacturing data from ISM and S&P Global. Pending home sales will wrap up the October housing data, and weekly MBA Mortgage Applications and home price indexes from FHFA and S&P CoreLogic Case-Shiller are also set for release. Fed Chairman Jerome Powell is scheduled to speak on Wednesday at the Brookings Institution in Washington which is also likely to garner some attention.
Did You Know?
DEBT DOWN – Global debt outstanding shrank by $6.4 trillion in the third quarter. The decline left outstanding global debt—including governments, households, and corporations—at $290 trillion, equating to 343% of the gross domestic product. Still, debt levels have been on the decline all year as soaring interest rates make it more difficult to borrow (source: the Institute of International Finance, The Wall Street Journal).
REAL ESTATE INVESTORS PULL BACK – Investor home purchases declined -30% in the third quarter, compared with the same period a year ago. Companies bought around 66,000 homes in the 40 markets tracked by real-estate brokerage Redfin during the third quarter, compared with 94,000 homes during the same quarter a year ago. The higher borrowing rates and home prices that have kept traditional buyers away have also made these firms pull back (source: Redfin, The Wall Street Journal).
WARDROBE CHANGE – U.S. clothing stores had 24.1% more inventory in September compared with a year earlier. Retailers’ inventory nightmare is turning out to be the stuff of off-price retailers’ dreams. The glut of available inventory has made it possible for discount retailers, like TJX Companies (owner of T.J. Maxx) and Ross Stores, to haggle with suppliers. Both off-price retailers raised their guidance for the fourth quarter (source: Census Bureau, The Wall Street Journal).
This Week in History
BULL RUSH – On November 21, 1995, the Dow Jones Industrial Average broke through the 5,000 index price level for the first time, just nine months after first closing above 4,000. Never before had the 1,000-point market milestone fallen so quickly, and even bullish analysts were astonished at the speed of the market’s rise (source: The Wall Street Journal).
Asset Class Performance
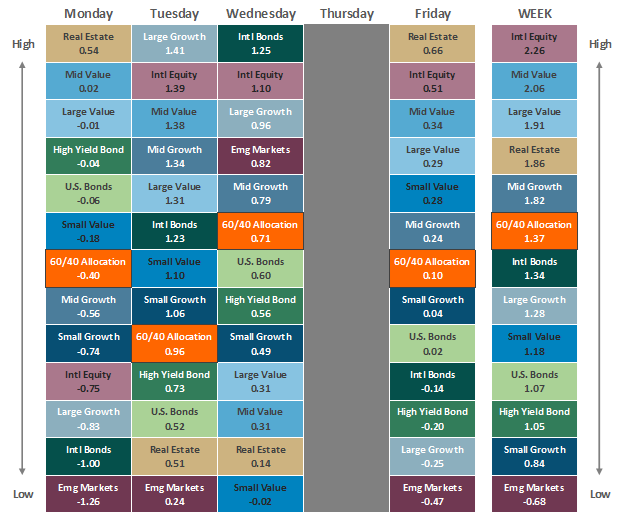
The Importance of Diversification. Diversification mitigates the risk of relying on any single investment and offers a host of long-term benefits, such as lowering portfolio volatility, improving risk-adjusted returns, and helping investments to compound more effectively.
Source: Bloomberg.
Asset‐class performance is presented by using market returns from an exchange‐traded fund (ETF) proxy that best represents its respective broad asset class. Returns shown are net of fund fees for and do not necessarily represent performance of specific mutual funds and/or exchange-traded funds recommended by The Retirement Planning Group. The performance of those funds may be substantially different than the performance of the broad asset classes and to proxy ETFs represented here. U.S. Bonds (iShares Core U.S. Aggregate Bond ETF); High‐Yield Bond (iShares iBoxx $ High Yield Corporate Bond ETF); Intl Bonds (SPDR® Bloomberg Barclays International Corporate Bond ETF); Large Growth (iShares Russell 1000 Growth ETF); Large Value (iShares Russell 1000 Value ETF); Mid Growth (iShares Russell Mid-Cap Growth ETF); Mid Value (iShares Russell Mid-Cap Value ETF); Small Growth (iShares Russell 2000 Growth ETF); Small Value (iShares Russell 2000 Value ETF); Intl Equity (iShares MSCI EAFE ETF); Emg Markets (iShares MSCI Emerging Markets ETF); and Real Estate (iShares U.S. Real Estate ETF). The return displayed as “Allocation” is a weighted average of the ETF proxies shown as represented by: 30% U.S. Bonds, 5% International Bonds, 5% High Yield Bonds, 10% Large Growth, 10% Large Value, 4% Mid Growth, 4% Mid Value, 2% Small Growth, 2% Small Value, 18% International Stock, 7% Emerging Markets, 3% Real Estate.
* The term basis points (bps) refers to a common unit of measure for interest rates and other percentages in finance. One basis point is equal to 0.01%. Bond prices and bond yields are inversely related. As the price of a bond goes up, the yield decreases.


