Quick Takes
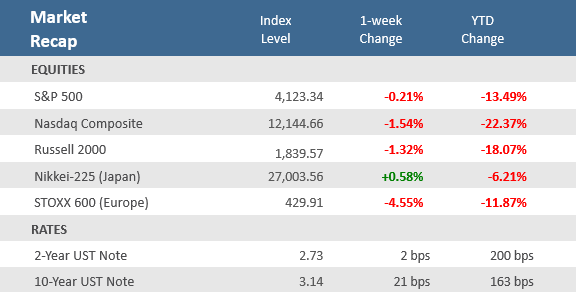
- Jittery markets, rising rates, and increased economic uncertainty persists as primary concerns for investors. A relatively mild -0.2% weekly decline masked yet more wild daily swings for stocks. It was the fifth consecutive weekly decline for the S&P 500, the longest weekly losing streak since June 2011.
- The yield on the benchmark 10-year Treasury note rose 21 basis point over the week to end at 3.14%. It crossed the 3% level for the first time since 2018, a swift increase from about 1.5% where ended 2021. As a result, mortgage rates and other long-term loans moved higher, which could pose a hurdle for further economic growth.
- Investors digested a lot of economic data which included JOLTS job openings that showed a record gap between the number of job openings and those seeking employment, as well as the April nonfarm payrolls report, which showed job growth beating expectations, but the labor force participation rate unexpectedly falling.
Markets continue to deal with headwinds, post fifth weekly loss
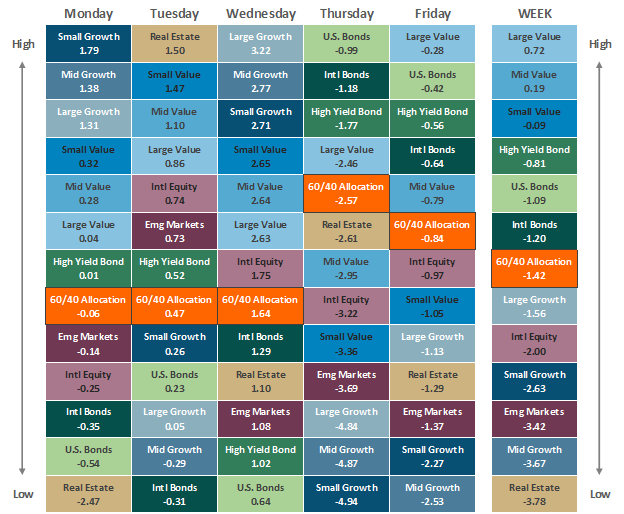
The first week of May is in the books, and jittery markets, rising rates, and increased economic uncertainty persists as primary headwinds for markets. For anybody that took the week off and didn’t check stock prices it looked like a rather uneventful week, with the S&P 500 down -0.2%, or essentially flat. But for those following the action, it was anything but a reprieve from the frenetic market swings in the first four months of 2022. Monday, the first trading day of May, saw the S&P 500 sink to its lowest levels of the year before staging a last hour comeback to close positive for the day. It was a rather stunning relief rally after the S&P 500 just completed its worst monthly performance since March 2020. The tech-heavy Nasdaq climbed +1.6% on the day, following its worst month since 2008. Stocks built on Monday’s late day rally on Tuesday with modest gains and then leapt higher on Wednesday. Fed chairman Jerome Powell delivered the expected 50 basis point rate hike Wednesday afternoon, but then he said they were not looking to raise rates in 75 basis point increments in the coming months, an unexpectedly dovish admission. The S&P 500 surged +3.0% by the end of the day for its best single day return since jumping +3.2% on May 18, 2020. But in true 2022 fashion, the exuberance ended there. Thursday brought a relentless and broad-based sell-off (more than 90% of the S&P 500 constituents fell), in which the index registered a one-day route of -3.57%, almost matching the -3.63% plunge on April 29, which was the worst single day pullback since June 11, 2020. Stocks slipped a bit more on Friday to make it five consecutive weekly declines, the longest weekly losing stretch since June 2011.
The yield on the benchmark 10-year Treasury note rose 21 basis point over the week to end at 3.14%. Yields move inversely to prices and 1 basis point is equal to 0.01%. On Monday the yield on the 10-year Treasury breached 3% for the first time since 2018. The move back to the 3% level has been swift after ending 2021 near 1.5%. The surge in Treasury yields has resulted in higher mortgage rates and other long-term loans, which could pose a hurdle for further economic growth. Higher bond yields also create competition for stocks, making them less of a relative bargain than when rates were near zero. Of course, there’s no way to know just how high rates may go, a lot of that will depend on how persistent inflation turns out to be, how tight the labor market will stay, and whether supply chain issues can get resolved.
Q1 earnings season is winding down, with about 436 of the S&P 500 companies having now reported. Thus far, roughly 67% have beat sales expectations and about 78% have beat earnings expectation, with blended earnings per share (which combines reported data with estimates for those that have yet to report) shows that earnings growth is up +8.6% while sales growth is up about +13.4% compared with the same quarter a year ago, according to data from FactSet Research. Overall, FactSet’s data shows that the percentage of S&P 500 companies beating EPS estimates is above the five-year average, but the magnitude of these positive surprises is below the five-year average. As a result, the index is reporting higher earnings for the first quarter today relative to the end of last quarter. However, the index is also reporting single-digit earnings growth for the first time since Q4-2020. So, while earnings growth remains positive and above trend, the rate of growth has decelerated, and that combined with higher inflation and interest rates is why stocks with high valuations, like technology and growth, have seen the sharpest declines this year.
Chart of the Week
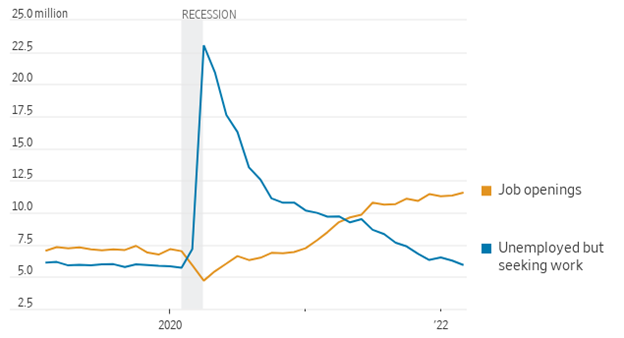
On Tuesday the Labor Department reported its Job Openings and Labor Turnover Survey (JOLTS), a measure of unmet demand for labor. It showed that jobs available to be filled increased 205,000 to 11.55 million in March, which was up from February’s upwardly-revised 11.34 million and above expectations for 11.20 million. That’s also a fresh record high for data that goes back to December 2000. The report showed the hiring rate remained at 4.5% in February, and job separations increased to 4.2% from 4.0% the prior month. The quit rate rose to 3.0% from February’s 2.9% pace—a new all-time high at 4.54 million positions. The gap between open jobs and available workers hit 5.6 million, another new high.
Record Jobs Gap
Employment openings have exceeded those seeking work
Economic Review
- April Nonfarm Payrolls rose by 428,000 jobs month-over-month, comfortably above expectations of a 380,000 rise, while March’s was revised lower to an increase of 428,000 from the initial reading of a 431,000 gain. Excluding government hiring and firing, private sector payrolls advanced by 406,000, also above forecast (390,000). Surprisingly, the labor force participation rate unexpectedly dipped to 62.2% from March’s unrevised 62.4% and fell short of expectations of an increase to 62.5%. The Bureau of Labor Statistics said job growth was widespread, led by gains in leisure and hospitality, in manufacturing, and in transportation and warehousing. The Unemployment Rate remained at 3.6%, versus forecasts calling for it to dip to 3.5%. The Underemployment Rate—including total unemployed and those employed part time for economic reasons, along with people who are marginally attached to the labor force—rose to 7.0% from the prior month’s 6.9% rate. Average hourly earnings were up +0.3% for the month, under expectations for a +0.4% increase, and March’s upwardly-revised +0.5% rise. Compared to last year, wage growth was up +5.5%, in line with expectations. Employment is the best contemporaneous indicator of the business cycle, and it shows no sign of a slowdown.
- The Federal Open Market Committee (FOMC) concluded its two-day monetary policy meeting on Wednesday, raising the target for the Fed funds rate by the widely anticipated 50 basis points (bps), the biggest rate hike since 2000. In its statement, the FOMC said that despite the downtick in economic activity in Q1, job gains have been robust, the unemployment has declined substantially, and household spending and business fixed investments continued to be strong. However, “Inflation remains elevated, reflecting supply and demand imbalances related to the pandemic, higher energy prices, and broader price pressures”. Additionally, the statement noted the Russia-Ukraine war, saying the “invasion of Ukraine by Russia is causing tremendous human and economic hardship. The implications for the U.S. economy are highly uncertain”. The statement noted that, “The invasion and related events are creating additional upward pressure on inflation and are likely to weigh on economic activity”. Regarding the Covid-related lockdowns in China, the FOMC statement noted it as a likely risk to exacerbate supply chain disruptions. Regarding its balance sheet, the Fed said that Committee participants agreed to the plan for reducing its securities holding in a deliberate manner. Starting June 1st, the Fed’s holdings of Treasury securities and agency debt and agency mortgage-backed securities will be reinvested to the extent that they exceed the monthly caps, which will be initially set at a combined level of $47.5 billion per month and will increase to $95 billion per month after three months. No updated economic projections were released at this meeting. In the post meeting press conference, Chairman Jerome Powell said that the labor market is extremely tight, and inflation is much too high, but the Fed has the tools needed to restore price stability. He characterized the American economy as very strong and well positioned to handle tighter monetary policy. Powell also mentioned that 50-basis point increases should be on the table for the next two meetings, and surprisingly said that 75-basis point increases are not something the Fed is actively considering.
- The April Institute for Supply Management (ISM) Manufacturing Purchasing Managers Index (PMI) unexpectedly declined but remains in expansion (levels above 50 denote expansion). The index fell to 55.4 from 57.1 in March, below expectations for an increase to 57.6. The softer-than-expected report came as both new orders and production fell but continued to grow. Inflation pressures cooled but remained elevated, with prices paid declining to 84.6. The ISM Services PMI showed that the key services sector decelerated but remains in expansion, falling to 57.1, from the 58.3 in March, which fell short of expectation for an increase to 58.5. Growth in business activity was offset by a decrease in new orders and a sharp drop in employment over the month, with employment crossing back into contraction territory. Meanwhile, new export orders fell, inventories rose, and prices paid jumped to a record level of 84.6. The ISM said, “Business activity remains strong; however, high inflation, capacity constraints and logistical challenges are impediments, and the Russia-Ukraine war continues to affect material costs, most notably of fuel and chemicals.”
- The final April S&P Global U.S. Manufacturing PMI Index was revised down to 59.2, below expectations to remain unrevised at 59.7. The index was above March’s reading of 58.8. A reading above 50 denotes expansion. S&P Global said the report signaled a sharp improvement in operating conditions across the U.S. manufacturing sector. The final S&P Global Services PMI was unexpectedly revised higher to 55.6 from the preliminary 54.7 level, where it was expected to remain, but was still below March’s reading of 58.0.
- March Construction Spending increased +0.1% month-over-month, below expectations for a +0.8% gain and February’s unrevised +0.5% rise. Residential spending grew +1.0%, but non-residential spending declined -0.8%.
- March Factory Orders increased +2.2%, easily beating expectations of a +1.2% rise, and well above the prior month’s -0.5% drop, which was revised higher to a +0.1% increase. Durable Goods Orders—preliminarily reported two weeks ago—were revised up to a +1.1% gain, and excluding transportation, orders were upwardly revised to a +1.4% gain. Finally, nondefense capital goods orders excluding aircraft—considered a proxy for capital spending—was upwardly revised to a +1.3% increase.
- The weekly MBA Mortgage Application Index rose +2.5%, following the prior week’s decrease of -8.3%, breaking seven straight weekly declines. The Refinance Index was up +0.2%, and the Purchase Index was up +4.1%. The average 30-year mortgage rate slipped by -1 basis point (bps) to 5.36% and remains up +219 bps from last year.
- Weekly Initial Jobless Claims were 200,000, for the week ended April 30, above expectations for 180,000, and down from the prior week’s upwardly revised 181,000. Continuing Claims for the week ended April 23 dropped by 19,000 to 1,384,000, below expectations of 1,399,000.
The Week Ahead
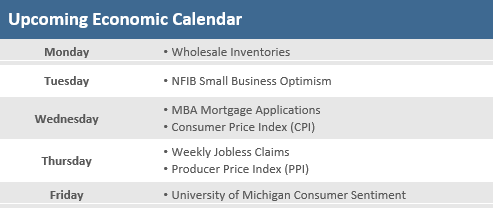
The calendar is quite light in the week ahead with inflation reports, both consumer (CPI) and producer (PPI), certain to be in focus. The April consumer price index is expected it to come in slightly below March’s 8.5%, signaling inflation may have peaked. We will also get a read on sentiment among small businesses with the NFIB Small Business Optimism Index, as well as consumers from the May preliminary University of Michigan Consumer Sentiment Index. Earnings season begins to wind down with about 10% of S&P 500 companies left to report. There are a host of Fed officials slated to speak in the wake of this week’s policy decision.
Did You Know?
IS INFLATION THE REASON? – The U.S. economy shrunk by an annualized -1.4% during the Q1- 2022, an 8.3 percentage point swing from +6.9% annualized growth recorded in the Q4-2021. Other than the volatile swings in growth in 2020 during the first year of the pandemic, the U.S. has not seen an 8.3 percentage point quarterly downward swing in the size of the economy since the Q4-1981 or 40 years ago when the economy went from a +4.9% growth rate to a -4.3% contraction quarter-over-quarter (source: Commerce Department, BTN Research).
ABOUT HALF – U.S. inflation, measured by the Consumer Price Index (CPI), was up +7.0% during 2021. Three percentage points (out of the 7 percentage points) is a function of direct fiscal support from the US government and how American households spent the pandemic-related money (source: Federal Reserve Bank of SF, BTN Research).
PEAK CRUDE – The highest level of crude oil production in U.S. history was 13.1 million barrels a day as of Friday 3/13/2020, the day President Donald Trump declared a national emergency due to the pandemic. As of Friday 4/22/2022, our national production of crude oil was 11.9 million barrels a day (source: Energy Information Administration, BTN Research).
This Week in History
MAGELLAN FUND’S BIRTHDAY – On May 2 in 1963, Edward C. Johnson II, the head of Fidelity Investments, started a small mutual fund and gave it to his son, Ned, to run. He called it the Magellan Fund. Magellan became perhaps the world’s best-known actively managed mutual fund, known particularly for its record-setting growth under the management of Peter Lynch from 1977 to 1990. Lynch averaged gains of +29% per year to crush the S&P 500 index by nearly 14% per year. For years it was the single largest mutual fund in the world until April 2000, when it was displaced by Vanguard’s S&P 500 index fund (source: Bloomberg, The Wall Street Journal).
Asset Class Performance
Source: Bloomberg. Asset‐class performance is presented by using market returns from an exchange‐traded fund (ETF) proxy that best represents its respective broad asset class. Returns shown are net of fund fees for and do not necessarily represent the performance of specific mutual funds and/or exchange-traded funds recommended by The Retirement Planning Group. The performance of those funds may be substantially different than the performance of the broad asset classes and to proxy ETFs represented here. U.S. Bonds (iShares Core U.S. Aggregate Bond ETF); High‐Yield Bond (iShares iBoxx $ High Yield Corporate Bond ETF); Intl Bonds (SPDR® Bloomberg Barclays International Corporate Bond ETF); Large Growth (iShares Russell 1000 Growth ETF); Large Value (iShares Russell 1000 Value ETF); Mid Growth (iShares Russell Mid-Cap Growth ETF); Mid Value (iShares Russell Mid-Cap Value ETF); Small Growth (iShares Russell 2000 Growth ETF); Small Value (iShares Russell 2000 Value ETF); Intl Equity (iShares MSCI EAFE ETF); Emg Markets (iShares MSCI Emerging Markets ETF); and Real Estate (iShares U.S. Real Estate ETF). The return displayed as “Allocation” is a weighted average of the ETF proxies shown as represented by: 30% U.S. Bonds, 5% International Bonds, 5% High Yield Bonds, 10% Large Growth, 10% Large Value, 4% Mid Growth, 4% Mid Value, 2% Small Growth, 2% Small Value, 18% International Stock, 7% Emerging Markets, 3% Real Estate.
Chris Bouffard is CIO of The Retirement Planning Group (TRPG), a Registered Investment Adviser. He has oversight of investments for the advisory services offered through TRPG.
Disclaimer: Information provided is for educational purposes only and does not constitute investment, legal or tax advice. All examples are hypothetical and for illustrative purposes only. Past performance of any market results is no assurance of future performance. The information contained herein has been obtained from sources deemed reliable but is not guaranteed. Please contact TRPG for more complete information based on your personal circumstances and to obtain personal individual investment advice.

