Quick Takes
- The conflict in Ukraine has intensified and the humanitarian aspect has become much more dire. Stock indices around the world declined, reflecting the deterioration of the situation, and the increased downside risk it poses to global inflation and growth.
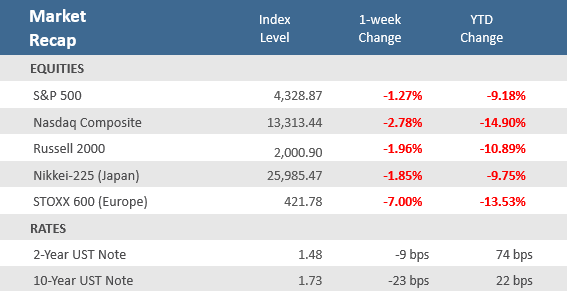
- The S&P 500 shed -1.3% while the Nasdaq fell -2.8 and the small-cap Russell 2000 lost -2.0%. Not surprisingly, European stocks suffered greater declines, sinking -7.0%. West Texas Intermediate crude oil topped $116 on Thursday, the highest level since 2008, and wheat prices moved to their highest level in 14 years.
- The U.S. economy is still exhibiting a very healthy labor market with another month of better-than-expected jobs growth and lower unemployment. Several manufacturing activity gauges also beat economists’ expectations, and construction spending signaled that the housing sector remains on solid footing.
Another turbulent week as Russia-Ukraine war fuels volatility
A second straight month of stronger-than-expected U.S. employment data, robust manufacturing activity, strong factory orders, and solid construction spending couldn’t overcome the negative sentiment from a worsening Russia-Ukraine conflict. Markets did rally hard on Wednesday following Congressional testimony by Federal Reserve Chairman Jerome Powell, during which he said he will propose a 25 basis-point (0.25%) hike at the March 15-16 Fed meeting, not the 50 basis-point hike markets had started to price in. But that was the extent of upside for risk assets during the week, as the S&P 500 was down the other four days of the week. Volatility has accelerated as Russia’s invasion of Ukraine has escalated. Wednesday’s +1.9% gain marked the sixth day in the prior seven that the S&P 500 moved more than 1% in either direction. Thursday and Friday were both down, but under that 1% threshold, as news that Russia has seized Europe’s largest nuclear power plant in Ukraine further unnerving already skittish investors. Western nations have imposed waves of sanctions on Russia since their invasion of Ukraine to increasingly isolate them, including cutting several Russian banks from the system that facilitates global money transfers, known as SWIFT. Over the last week, index providers MSCI and FTSE Russell have announced that they will be removing Russian equities from their indices.
The three major global credit rating agencies all downgraded Russia’s sovereign debt to the high-yield category just above default. Many of the oligarchs allied with Putin have also been sanctioned and have had various assets seized, such as properties and yachts. There are concerns that as sanctions targeting Russia expand, Russia may strike back by cutting exports of their vast natural resources and commodities. Russia accounts for 13% of global crude oil production, 17% of natural gas production, and nearly a tenth of global wheat supplies. Any disruptions in those areas could exacerbate already-strained supply chains and spark even higher prices, which have already surged since the conflict began. It is highly uncertain what the ultimate geopolitical and macroeconomic impact will be from the conflict. Still, it is highly probable that it will result in higher global inflation and an erosion of global growth. As we recently communicated to clients, we remain firmly overweight to U.S. equity and bonds, have eschewed emerging market products that invest in non-freedom oriented countries like Russia and China, and continue to mitigate exposure to inflation-susceptible assets. We remain constructive on the U.S. economy, which is coming off its best year of economic growth since 1984, and as detailed below, is still supported by a very strong labor market, a robust manufacturing environment, a solid housing market, and positive corporate earnings. The Russian-Ukraine crisis increases near-term risks and is expected to remain a source of heightened market volatility, but the U.S. economic expansion should persist.
It is important to state that this commentary attempts to objectively review the capital markets and the economic environment and in no way is intending to trivialize the tragic loss of life and humanitarian hardship that the developing war is inflicting on the people of Ukraine. It is our hope that the conflict deescalates as soon as possible and that a peaceful reestablishment of Ukraine can be achieved.
Chart of the Week
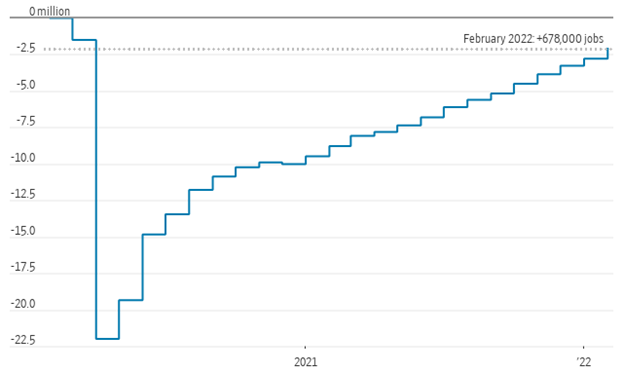
Geopolitics put the economic calendar in the back seat again this week, but there were some noteworthy positive economic reports during the week. Chief among those was Friday’s February nonfarm payrolls and employment report that showed strong hiring and low unemployment, pointing to a healthy post-pandemic labor market. U.S. employers added 678,000 jobs to their payrolls in February, the biggest gain in seven months and well above the expectations for 440,000. As shown in the Chart of the Week, this puts the U.S. just -1.7 million jobs below the jobs level prior to the pandemic. The Unemployment Rate fell to 3.8% from 4.0% last month—below forecasts of 3.9%—putting it closer to the 50-year low of 3.5% just before the pandemic. Wage growth did slow slightly in February but remained near historically high levels. Average Hourly Earnings rose a seasonally adjusted +5.1% in February from the previous year, below the +5.5% gain in January, and below expectations for a +5.8% rise.
The weaker-than-expected wage gains were likely due in part to the fact that many of the jobs added in February were in the relatively lower-paid leisure and hospitality sector (which accounted for 179,000 of the 678,000 new jobs added). This is the last jobs report before the Federal Reserve’s March 15-16 meeting and probably doesn’t do anything to change Fed Chairman Jerome Powell’s statement on Wednesday that he will be recommending a 25 basis point (0.25%) rate hike at that meeting.
Strong Job Growth, Again
U.S. nonfarm payroll employment, change since February 2020.
Source: Labor Department, The Wall Street Journal. Note: Seasonally adjusted
Economic Review
- U.S. manufacturing activity powered ahead in February despite deepening supply-chain troubles. The Institute for Supply Management (ISM) Manufacturing Purchasing Managers Index (PMI) rose to 58.6 in February from 57.6 in January, beating expectations of 58.0, led by strong demand from customers at home and abroad. A reading above 50 indicates activity is expanding, below 50 contracting. Growth in new orders, production, inventories, and supplier deliveries all accelerated, while employment declined. Prices paid cooled a bit, decreasing 0.5 points to 75.6. The ISM Services PMI showed and unexpected decline in activity, falling to 56.5 from the 59.9 in January, and well under expectations for an increase to 61.1. Growth in new orders and business activity both declined month-over-month, and employment dropped back into contraction territory.
- The final February Markit U.S. Manufacturing PMI Index was downwardly revised to 57.3, just below the Bloomberg estimates for an unrevised 57.5 level, but above January’s 55.5. New orders saw a sharper uptick midway through the first quarter, supported by strong demand from new and existing customers. In addition, foreign client demand also strengthened as new export orders rose at the fastest pace in five months. The final Markit Services PMI Index was also unexpectedly revised lower to 56.5 from the preliminary 56.7 level, where it was forecasted to remain, but was still well above January’s reading of 51.2.
- Regional manufacturing activity was mixed but continues to show expansion. The Chicago PMI fell to 56.3, more than expected, but remained in expansion territory (above 50). That was well below January’s 65.2 reading as well as expectations for a decrease to 62.3. The weaker-than-expected report came as growth in new orders and production continued, but at slower rates, supplier delivery times expanded at a slower rate, and the contraction in employment accelerated. Prices paid did decelerate but remained in expansion territory. The Dallas Fed Manufacturing Index moved further into expansion territory (levels above zero) than expected for February with a rise to 14.0 from 2.0 in January and compared to expectations of 4.3. New orders and shipments grew at faster paces, while production slowed.
- January Construction Spending rose +1.3%, beating expectations for a +0.1% gain and December’s upwardly revised +0.8% gain. Residential and non-residential spending both increased +1.3%.
- January Factory Orders rose +1.4%, well above estimates of +0.7%, and the prior month’s -0.4% decline was revised to a +0.7% increase. Durable Goods Orders were unrevised from last week’s preliminary report at a +0.6% rise, and excluding transportation, orders were unadjusted at a +0.7%.
- Weekly unemployment claims fell more than the expected 225,000 to 215,000, which was well below the prior week’s upwardly revised 233,000. Continuing claims, a proxy for the total number of people on unemployment rolls through regular state programs, were slightly higher by 2,000 to 1,476,000, and above estimates of 1,420,000.
The Week Ahead
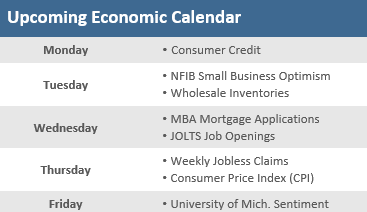
The Russia-Ukraine conflict will likely remain center stage next week with the Fed into its quiet period ahead of its March 15-16 monetary policy decision meeting and the economic calendar relatively light. The February inflation picture will be in focus with the release of the Consumer Price Index (CPI) on Thursday, which forecasts are for it to remain at the highest level in 40 years at a +7.9% annual rate. Other reports that may get attention include the NFIB Small Business Optimism and the preliminary March University of Michigan Consumer Sentiment Index.
Did You Know?
GAS AND OIL – The national average for a gallon of regular gas stood at $3.83 on Friday, the highest since Sept. 21, 2012, according to data from AAA. Americans are paying about 27 cents more than last week, and 41 cents more than a month ago. In California, the state average is now $5.07 per gallon. Surging oil prices are behind the gas price spike, with West Texas Intermediate crude topping $116 on Thursday, the highest level since 2008. More than 50% of the cost of gasoline is based on the price of oil, according to the U.S. Energy Information Administration. Costs associated with refining, distribution, marketing, and taxes make up the rest of the price of gasoline. (Source: CNBC, Bloomberg).
NOT A GREAT RETURN – A high-income American couple who retired in 2020 is projected to pay $828,000 (stated as a 2021 present value number) in lifetime Social Security payroll taxes and is projected to receive $849,000 (stated as a 2021 present value number) in lifetime Social Security benefits, i.e., for every $1 paid in taxes, the couple will receive $1.03 in benefits (Source: Tax Policy Center, BTN Research).
HEALTH CARE RETURN HIGHER – A high-income American couple who retired in 2020 is projected to pay $223,000 (stated as a 2021 present value number) of lifetime Medicare payroll taxes and is projected to receive $510,000 (stated as a 2021 present value number) of Medicare benefits, i.e., for every $1 paid in taxes, the couple will receive $2.29 in benefits (Source: Tax Policy Center, BTN Research).
This Week in History
Happy 65th Birthday S&P – On March 4, 1957, Standard & Poor’s Corp. introduced a new stock index, which it initially called the “Standard ‘500’ Index” but is now known as the S&P 500 Index. S&P launched its first stock index back in 1923, but it was S&P 500 that went on to become the primary gauge for U.S. stock performance. The S&P 500 is comprised of the largest 500 U.S. equities chosen for market size, liquidity, and industry group representation. It is a market value-weighted index with each stock’s weight in the index proportionate to its market value. At Friday’s close (March 4, 2022) the S&P 500 was at 4,329, representing a total return (i.e., with dividends reinvested) of 68,429%, or 10.6% annualized, since its inception (Source: Benzinga, Bloomberg).
Asset Class Performance
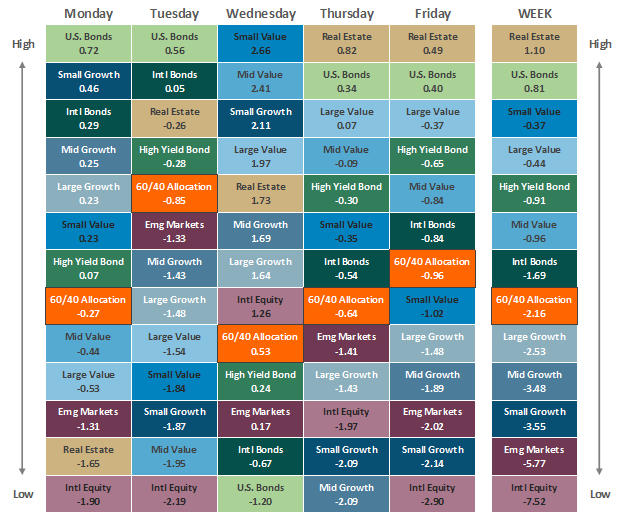
The Importance of Diversification. Diversification mitigates the risk of relying on any single investment and offers a host of long-term benefits, such as lowering portfolio volatility, improving risk-adjusted returns, and helping investments to compound more effectively.
Source: Bloomberg. Asset‐class performance is presented by using market returns from an exchange‐traded fund (ETF) proxy that best represents its respective broad asset class. Returns shown are net of fund fees for and do not necessarily represent the performance of specific mutual funds and/or exchange-traded funds recommended by The Retirement Planning Group. The performance of those funds may be substantially different than the performance of the broad asset classes and to proxy ETFs represented here. U.S. Bonds (iShares Core U.S. Aggregate Bond ETF); High‐Yield Bond (iShares iBoxx $ High Yield Corporate Bond ETF); Intl Bonds (SPDR® Bloomberg Barclays International Corporate Bond ETF); Large Growth (iShares Russell 1000 Growth ETF); Large Value (iShares Russell 1000 Value ETF); Mid Growth (iShares Russell Mid-Cap Growth ETF); Mid Value (iShares Russell Mid-Cap Value ETF); Small Growth (iShares Russell 2000 Growth ETF); Small Value (iShares Russell 2000 Value ETF); Intl Equity (iShares MSCI EAFE ETF); Emg Markets (iShares MSCI Emerging Markets ETF); and Real Estate (iShares U.S. Real Estate ETF). The return displayed as “Allocation” is a weighted average of the ETF proxies shown as represented by: 30% U.S. Bonds, 5% International Bonds, 5% High Yield Bonds, 10% Large Growth, 10% Large Value, 4% Mid Growth, 4% Mid Value, 2% Small Growth, 2% Small Value, 18% International Stock, 7% Emerging Markets, 3% Real Estate.
Chris Bouffard is CIO of The Retirement Planning Group (TRPG), a Registered Investment Adviser. He has oversight of investments for the advisory services offered through TRPG.
Disclaimer: Information provided is for educational purposes only and does not constitute investment, legal or tax advice. All examples are hypothetical and for illustrative purposes only. Past performance of any market results is no assurance of future performance. The information contained herein has been obtained from sources deemed reliable but is not guaranteed. Please contact TRPG for more complete information based on your personal circumstances and to obtain personal individual investment advice.


