Quick Takes
- A strong countertrend rally in technology and growth stocks helped push stock indices to their best week of the year. Most major global equity indices were up +5% or more for the week, which helped return many major indices to positive territory for the month.
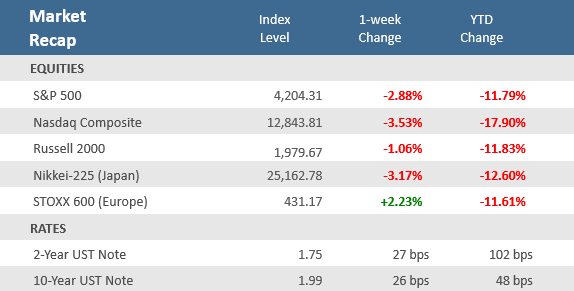
- Treasury yields rose sharply following what looks to be the most aggressive pace of Fed rate hikes in more than 15 years. The yield on the benchmark 10-year U.S. Treasury note settled at 2.15%, up from 1.99% the prior Friday, hitting its highest weekly close since June 2019.
- On the economic front, wholesale inflation showed prices remain elevated at decade-high annual gains, retail sales disappointed, and housing data was mostly below expectations as homebuilder confidence, building permits and existing home sales all fell, but housing starts were well above forecasts.
Stocks notched their best week since November 2020
Following several weeks of losses in the aftermath of the Russian invasion of Ukraine, this week saw a strong countertrend rally in technology and growth stocks that helped push stock indices to their best week of the year. The S&P 500 Index was up about +6.2% for the week, the Nasdaq was up +8.2%, and the Russell 2000 small-cap index was up +5.4%. This week’s gains have returned all the major indices to positive territory this month, despite elevated oil and other commodity prices and the continuing war in Ukraine. It’s been more than three weeks since Russia launched its invasion of Ukraine, and Russian artillery attacks continued to bombard residential areas throughout the week. According to reports from the United Nations, Russia has killed 847 Ukrainian civilians since Russia invaded and has forced more than 10 million Ukrainians to abandon their homes. Still, the Russian Defense Ministry showed no sign of letting up even though it appears its own military has taken significant losses. The conflict has weighed down global stock markets until the bounce back this week. Currently, there is no exit strategy or sense of the next set of sanctions.
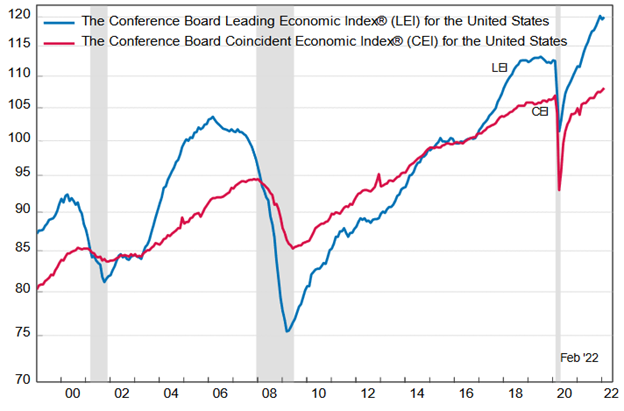
Investors have also had to contend with the prospects of tighter monetary policy, which, as was widely expected, was confirmed this week with the Federal Reserve launching its rate-hike campaign, raising the target for the fed funds rate by 25 bps. It also establishes a more hawkish tilt by indicating that it sees six additional increases this year and four next year. Regarding the Fed’s balance sheet, Fed chairman Powell indicated that the FOMC discussed quantitative tightening in depth during the week’s meeting and that it could start shrinking its bond holdings as early as May. Treasury yields rose sharply following what looks to be the most aggressive pace of rate hikes in more than 15 years. The yield on the benchmark 10-year U.S. Treasury note settled at 2.15%, up from 1.99% the prior Friday and its highest weekly close since June 2019. The yield curve flattened noticeably which prompted some discussion among market watchers about an increased risk from a Fed-induced recession. But other economic news released during the week showed that the risk of recession in the next twelve months is still relatively low. As shown in the Chart of the Week, the Conference Board’s Leading Economic Indicators index, a composite of 10 forward-looking economic activity gauges, increased in February and is still nicely positive on a year-over-year percentage basis with a robust 8 of the 10 components positively contributing to the February increase. Moreover, the labor market continues to show strength, with weekly unemployment claims doing better than expectations and at levels near historic lows.
Chart of the Week
The Conference Board’s Leading Economic Index (LEI) rose +0.3% in February, matching expectations, and a nice rebound from January’s negatively revised -0.5% decline. Year-over-year, the LEI was up a healthy +7.6%. The index rebounded from the first negative monthly reading since February 2021. The LEI is comprised of 10 components that tend to precede changes in overall economic activity. February results were robust, with eight of the index’s ten components contributing positively to the rise. The LEI has been a good recessionary indicator, as it has peaked an average of 12 months (and turned negative on a year-over-year basis) prior to the last eight recessions. The Index of Coincident Economic Indicators (CEI) improved +0.4% in February (and +4.0% annually) following a +0.3% January gain, revised down from +0.5%. Each of its four components contributed positively to the increase. However, the Conference Board notes that the latest results do not reflect the full impact of the Russian invasion of Ukraine, which could lower the trajectory for the U.S. LEI and signal slower-than-anticipated economic growth in the first half of the year.
U.S. Leading Economic Indicator Index Rebounds in February
Leading and Coincident Economic Indicators rise in February
Source: The Conference Board. Note: Shaded areas represent recessions.
Economic Review
- Wholesale inflation increased further in February as the Producer Price Index (PPI) rose+ 0.8% month-over-month, under forecasts of +0.9% and January’s unrevised +1.0% increase. Core PPI, which excludes food and energy, gained +0.2% for the month, also below estimates of +0.6% and the prior month’s unadjusted +0.8% rise. Year-over-year, headline PPI surged +10.0%, above the prior month’s +9.7% rise, and in line with expectations. Core PPI increased +8.4% annually, below estimates of +8.7% and slightly above January’s +8.3% gain.
- The Import Price Index rose +1.4% in February, below expectations for +1.6%, and January’s downwardly revised +1.9% increase. Import prices were up +10.9% from last year, which was also below expectations of +11.3% but above January’s downwardly revised +10.7% rise.
- The initial estimate for February Retail Sales rose +0.3% month-over-month, under expectations of +0.4%, and well below January’s positively revised +4.9% surge. Ex-autos retail sales grew +0.2% month-over-month, below expectations of +0.9% and below January’s +4.4%. The control group, a figure used to calculate GDP, declined -1.2% for the month, far below the expectation for a +0.3% rise and January’s upwardly revised +6.7% jump.
- The National Association of Home Builders (NAHB) Housing Market Index showed homebuilder confidence in March slid to 79, its lowest level in six months, down from 81 in February and below expectations of 81. The NAHB said that builders are reporting growing concerns and expect higher interest rates connected to tightening monetary policy “will price prospective home buyers out of the market,” adding, “The impact of elevated inflation and expected higher interest rates suggests caution for the second half of 2022.”
- February Housing Starts rose +6.8% to an annual pace of 1,769,000 units, above forecasts of 1,700,000 units, and January’s upwardly revised 1,657,000 units. However, Building Permits, one of the leading indicators tracked by the Conference Board (it is a gauge of future construction), fell by -1.9% to an annual rate of 1,859,000 units, above expectations of 1,845,000, but below the downwardly revised 1,895,000 unit pace in January.
- February Existing Home Sales fell -7.2% to an annual rate of 6.0 million units, below expectations of 6.1 million units, and January was revised slightly lower to 6.49 million. Contract closings hit a 6-month low, as sales in all the major U.S. regions fell in February, while year-over-year sales were also lower in all regions except the South. The median existing home price was up +15.0% from a year ago to $357,300, marking the 120th straight month of annual gains as prices rose in all regions. Unsold inventory was at a 1.7-months, up from the from 1.6-months a year ago. Existing home sales account for a large majority of the home sales market and reflect contract closings instead of signings.
- February Industrial Production was up +0.5%, matching expectations but below January’s unrevised +1.4% rise. Capacity Utilization rose to 77.6% from the prior month’s downwardly-adjusted 77.3%, below forecasts for an increase to 77.9%.
- The Empire State (NY) Manufacturing Index, a measure of activity in the New York region, showed a deep contraction (a reading below zero) with a -11.8 reading in March, down from +3.1 in February and far under expectations for an increase to +6.4. The decline came as new orders and employment both decreased, with the former moving back below zero.
- The March Philly Fed Manufacturing Business Outlook Index accelerated more than expected, moving further into expansion territory (a reading above zero), rising to 27.4 versus expectations for a decrease to 14.5 and February’s 16.0 level. New orders and shipments grew at a faster pace and employment growth accelerated.
- Weekly unemployment claims fell unexpectedly by 15,000 to 214,000 versus estimates of 220,000 and the prior week’s upwardly revised 229,000. Continuing claims, a proxy for the total number of people on unemployment rolls through regular state programs, fell by 71,000 to 1,419,000, above estimates of 1,450,000.
The Week Ahead
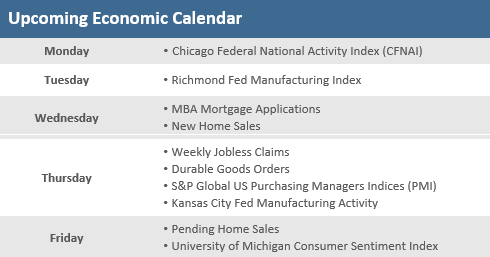
The U.S. economic calendar is relatively light next week, but the focus will continue to focus on the ongoing war in eastern Europe. Economic data that may garner some attention is likely to be the first look at manufacturing and services activity for March via the S&P Global (formerly IHS Markit) Manufacturing and Services PMIs, as well as regional manufacturing activity reports from the Chicago, Richmond, and Kansas City Federal Reserve districts. Housing data continues with the releases of February New Home Sales and Pending Homes Sales on Wednesday and Friday, respectively. Friday also brings the final release of the University of Michigan Consumer Sentiment Index. There are more than a dozen speeches by members of the Federal Reserve, including two from Fed Chairman Jerome Powell who appears at an economics conference Monday and at an international banking conference Wednesday.
Did You Know?
ADDING TO CASH – Money market funds in the United States (including retail and institutional funds, both taxable and tax-free) have increased $799 billion (to $4.6 trillion from $3.8 trillion) over the trailing 24 months as of last Friday 3/11/2022, an average increase of $1.1 billion a day. President Donald Trump declared a national emergency as a result of the pandemic on Friday 3/13/2020 (source: Investment Company Institute, BTN Research).
READY FOR A CHANGE – 27.1 million Americans moved last year, 8.4% of the US population. That’s the lowest percentage of Americans that reported living at a different residence based on an annual survey conducted since 1948. Of the 27.1million movers in 2021, just 4.4 million people moved out-of-state. 25 years earlier (1996), 16.3% of Americans moved in the prior 12 months (source: Census Bureau, BTN Research).
THE AVERAGE WORKER – Average hourly earnings in the private sector (nonfarm) reached $31.58 an hour as of 2/28/2022, up +5.1% on a year-over-year basis. 10 years earlier (2/29/2012), average hourly earnings in the private sector were $23.27 an hour (source: Bureau of Labor Statistics, BTN Research).
This Week in History
Happy Day – On March 15, 1933, the New York Stock Exchange reopened after having been closed for two weeks during President Franklin D. Roosevelt’s bank holiday. Pent-up investors busted loose in a bullish stampede, whooping and hollering as they propelled the Dow Jones Industrial Average to its biggest one-day percentage gain yet on record, a +15.3% surge to close at 62.10. With the Dow at 34,755 as of Friday, March 18, 2022, it would have to climb more than 5,318 points to break the one-day percentage gain record (source: The Wall Street Journal).
Asset Class Performance
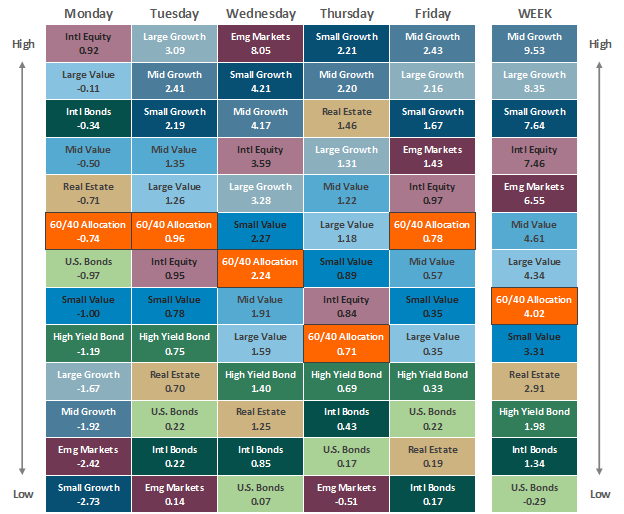
The Importance of Diversification. Diversification mitigates the risk of relying on any single investment and offers a host of long-term benefits, such as lowering portfolio volatility, improving risk-adjusted returns, and helping investments to compound more effectively.
Source: Bloomberg. Asset‐class performance is presented by using market returns from an exchange‐traded fund (ETF) proxy that best represents its respective broad asset class. Returns shown are net of fund fees for and do not necessarily represent the performance of specific mutual funds and/or exchange-traded funds recommended by The Retirement Planning Group. The performance of those funds may be substantially different than the performance of the broad asset classes and to proxy ETFs represented here. U.S. Bonds (iShares Core U.S. Aggregate Bond ETF); High‐Yield Bond (iShares iBoxx $ High Yield Corporate Bond ETF); Intl Bonds (SPDR® Bloomberg Barclays International Corporate Bond ETF); Large Growth (iShares Russell 1000 Growth ETF); Large Value (iShares Russell 1000 Value ETF); Mid Growth (iShares Russell Mid-Cap Growth ETF); Mid Value (iShares Russell Mid-Cap Value ETF); Small Growth (iShares Russell 2000 Growth ETF); Small Value (iShares Russell 2000 Value ETF); Intl Equity (iShares MSCI EAFE ETF); Emg Markets (iShares MSCI Emerging Markets ETF); and Real Estate (iShares U.S. Real Estate ETF). The return displayed as “Allocation” is a weighted average of the ETF proxies shown as represented by: 30% U.S. Bonds, 5% International Bonds, 5% High Yield Bonds, 10% Large Growth, 10% Large Value, 4% Mid Growth, 4% Mid Value, 2% Small Growth, 2% Small Value, 18% International Stock, 7% Emerging Markets, 3% Real Estate.
Chris Bouffard is CIO of The Retirement Planning Group (TRPG), a Registered Investment Adviser. He has oversight of investments for the advisory services offered through TRPG.
Disclaimer: Information provided is for educational purposes only and does not constitute investment, legal or tax advice. All examples are hypothetical and for illustrative purposes only. Past performance of any market results is no assurance of future performance. The information contained herein has been obtained from sources deemed reliable but is not guaranteed. Please contact TRPG for more complete information based on your personal circumstances and to obtain personal individual investment advice.


