Quick Takes
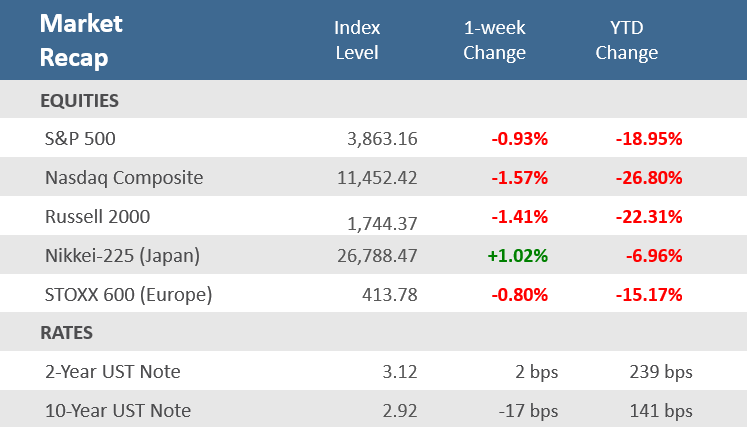
- Despite a solid and broad-based rally on Friday stocks ended the week lower. The S&P 500 was up +1.9% Friday, ending a five-day losing streak, which limited the week’s loss to -0.9%. Small caps and growth saw slightly larger losses for the week with the Russell 2000 down -1.4% and the Nasdaq down -1.6%.
- The biggest headline came midweek as consumer inflation rose to another 40-year high as CPI jumped +9.1% from the prior June, hotter-than-the expected +8.8%, and May’s unrevised +8.6%, which was the prior 40-year record high. Core CPI, which strips out food and energy, increased +5.9% for the year ended June, also above expectations.
- The hot inflation data had investors fearing the Federal Reserve would resort to a full percentage point rate hike next week, but by the end of the week, those expectations faded as Fed officials downplayed the odds of a full-point hike and suggesting that a 0.75 percentage point hike would be appropriate.
Markets down on the week but end strong with a Friday rally.
Stocks continue to trade choppy but finished the week with a broad-based rally to limit the week’s losses at moderate levels. The S&P 500 was up +1.9% Friday, ending a five-day losing streak, and putting the week’s loss at -0.9%. Small caps, technology and growth saw slightly larger losses for the week with the Russell 2000 down -1.4% and the Nasdaq down -1.6%. Not surprisingly, it was the U.S. consumer that rescued the markets on Friday as a strong retail sales report showed Americans kept on spending in June despite a surge in gas and inflation. Shopping, a key driver of U.S. economic growth, in June was brisk across a broad range of categories helping counter the narrative that an economic recession is imminent. But like the markets in 2022, economic data has been anything but steady. Earlier in the week June data showed manufacturing output fell for a second straight month and consumer sentiment in July remains near the lowest level on record set in June—although it did improve some which exceeded expectations for it to remain at the June record low. But perhaps the biggest headline came midweek as consumer inflation rose to another 40-year high with CPI up +9.1% from the prior June, hotter-than-the expected +8.8%, and May’s unrevised +8.6%, which was the prior 40-year record high. The hot inflation data had investors fearing the Federal Reserve would resort to a full percentage point rate hike next week, but by the end of the week, those expectations faded as Fed officials downplayed the odds of a full-point hike and suggesting that a 0.75 percentage point hike would be appropriate. The uncertainty in expectations for how the Fed would react to strong inflation data could be seen in the Treasury market. The yield on the U.S 10-year Treasury note declined -17 basis points from 2.92% to 3.09% a week ago, but the 2-year Treasury yield rose 2 basis points. As a result, the closely-watched 2-year/10-year yield curve inverted more deeply as mid-to-long term rates were lower reflecting recession concerns, while short-term rates were buoyed by the increased expectations that the Fed will have to be more aggressive with tightening monetary policy. The 2-year/10-year yield curve inversion finished at -20 bps on Friday but fell as deeply as -27 bps in the wake of the CPI report.
Chart of the Week
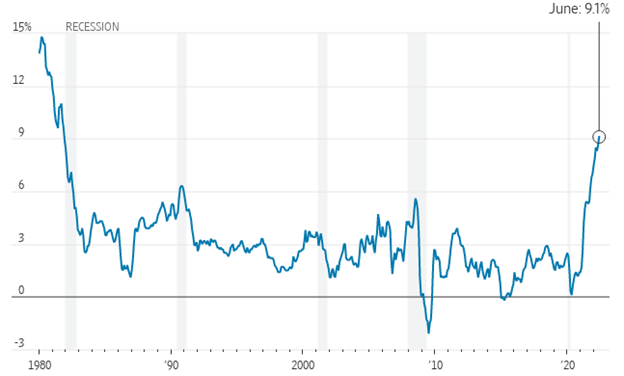
Inflation data for June came in hotter-than-expected on Wednesday. The Consumer Price Index (CPI) rose +1.3% for the month of June and accelerated +9.1% on an annual basis—a pace not seen since November 1981. A significant jump in gasoline prices—up +11.2% from the previous month and nearly +60% from a year ago—drove much of the gain. The price increases were more than expected, with forecasts for a monthly increase of +1.1%, and an annual increase of +8.8%. June was above May’s unrevised +1.0% monthly gain and 8.6% annual rise. Core CPI, which strips out food and energy, increased +0.7% in the month of June and +5.9% for the year ended June. Again, both were above expectations, which were +0.5% for the month and +5.7% for the year, as well as May’s levels of an unadjusted +0.6% increase for the month and +6.0% for the year. The Department of Labor (DoL) said the increase was broad-based, in addition to gasoline, shelter, and food were big contributors. For the core rate, the DoL said while almost all major component indexes increased over the month, the largest contributors were for shelter, used cars and trucks, medical care, motor vehicle insurance, and new vehicles. Among the few major component indexes to decline in June were lodging away from home and airline fares.
June Inflation data hotter-than-expected
U.S. consumer-price index, 12-month change.
Note: Shaded regions represent U.S. recessions.
Source: Labor Department, The Wall Street Journal
Economic Review
- Like consumer prices, producer prices came in hotter than expected. The Producer Price Index (PPI), rose +1.1% in June, above expectations of +0.8%, and May’s upwardly revised +0.9%. However, Core PPI, which excludes food and energy, rose +0.4%, under expectations of +0.5%, and May’s upwardly revised +0.6%. Year-over-year, the headline PPI was up +11.3%, above expectations of +10.7%, and May’s upwardly revised +10.9%. Core PPI was up +8.2%, in line with expectations and below May’s unadjusted +8.3% rise.
- Despite the four-decade high inflation, U.S. Retail Sales rebounded strongly in June as Americans spent more on gasoline and other goods, which may help dispel fears of an imminent recession, but probably not enough to change the view that economic growth in the second quarter has cooled. According to the Commerce Department, the advanced report on retail sales for June rose +1.0% for the month, beating expectations for a 0.9% rise, and much better than -0.1% in May which was revised up from -0.3%. Sales ex-autos and gas were up +0.7%, well ahead of estimates for a +0.1% rise. The control group, a figure used to calculate GDP, rose +0.8%, above expectations of +0.3%, and May’s downwardly revised -0.3% decrease. Sales at gasoline stations led June sales, reflecting the surge in gas prices, but e-commerce, motor vehicles, furniture, and food services and drinking places showed solid gains. Building materials, clothing, and health & personal care sales all fell.
- The preliminary July University of Michigan Consumer Sentiment Index unexpectedly rose to 51.1 from 50.0 in June, where it was expected to remain, which was an all-time low. A continued deterioration in the Expectations component of the report was more than offset by a solid improvement in the Current Conditions component. Importantly, the 1-year inflation expectations slid to 5.2% from 5.3% in June, where it was expected to remain. Likewise, the 5-10-year inflation expectations also declined to 2.8%, from 3.1%, compared to forecasts of a dip to 3.0%.
- The June National Federation of Independent Business (NFIB) Small Business Optimism Index fell to 89.5 from 93.1 in May, well below expectations for a decrease to 92.5, and is now at the lowest level since early 2013. Small businesses expecting better business conditions over the next six months decreased to a net negative 61%, the lowest level recorded in the survey’s history. The NFIB said, “On top of the immediate challenges facing small business owners including inflation and worker shortages, the outlook for economic policy is not encouraging either as policy talks have shifted to tax increased and more regulations.”
- The Import Price Index rose +0.2% for the month of June, well below expectations of +0.7%, and down from +0.5% in May, which was revised down from +0.6%. Excluding petroleum, import prices fell -0.4%, far below expectations of +0.2%. Year-over-year, prices rose +10.7%, well below expectations of +11.4%, and May was revised down to +11.6% from +11.7%.
- June Industrial Production slid -0.2%, below expectations of +0.1%, and May’s downwardly revised flat reading. Despite manufacturing output being down for a second straight month, it rose at an annual growth rate of +4.2% for Q2-2022. Capacity Utilization dipped to 80.0% from May’s upwardly revised 80.3%, under expectations for an increase to 80.8%.
- The June Empire State Manufacturing Index, a measure of activity in the New York region, unexpectedly jumped back to expansion (a reading above zero). The index rose to 11.1 from -1.2 in June and far above expectations for a decline to -2.0.
- The weekly MBA Mortgage Application Index fell -1.74% following the prior week’s -5.4% decline. The Refinance Index rose +2.2% from last week but the Purchase Index was down -3.6% for the week. The decline came even as the average 30-year mortgage rate holding at 5.74%, but that is still up +259 bps from last year.
- Weekly Initial Jobless Claims were 244,000, for the week ended July 9, above expectations for 235,000, which was the prior week’s unrevised level. Continuing Claims for the week ended July 2 were down 41,000 to 1,311,000, below expectations of 1,380,000.
The Week Ahead
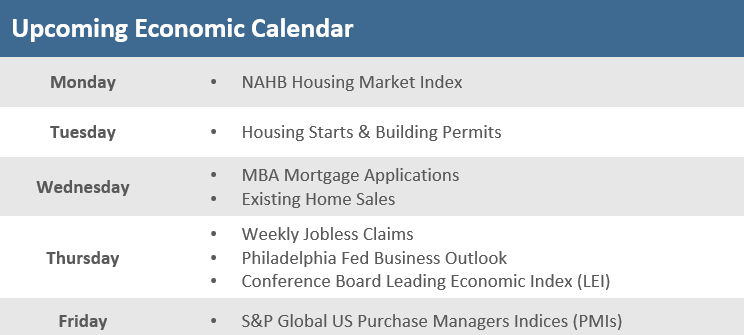
The economic calendar is sparse next week, and the Fed will be in quiet mode ahead of their July 27 FOMC monetary policy decision. As a result, the earnings report will probably take center stage as earnings season shifts into high gear. Next week will feature earnings from companies including Bank of America, Goldman Sachs, Lockheed Martin, Netflix, Johnson & Johnson, United Airlines, Tesla, American Airlines, and Verizon. Of the reports on the economic docket, most are housing related with July home prices, as well as home starts, existing home sales, and building permits for June. Outside of housing data, the Conference Board’s Leading Economic Index for June will also come into focus, along with S&P Global’s preliminary July U.S. Manufacturing and Non-Manufacturing PMIs. With U.S. economic data light, the overseas economic calendar may garner more attention as monetary policy decisions are due for the Eurozone and Japan. Additionally, Eurozone data for consumer confidence, construction output, and the final read on consumer price inflation is due.
Did You Know?
THE $1,000 CAR… LOAN PAYMENT – Consumers have never paid more to finance their cars. Monthly payments on loans made in June to buy a new car averaged an all-time high of $686 for data going back to 2005. That is up 4% from January and 13% above a year ago. A growing share of people are paying much more. A record 12.7% of new-car buyers who signed up for a loan in June have a monthly payment of at least $1,000. That share is up from roughly 7% a year earlier, 5% in June 2019, and 2% in June 2010 (source: Edmunds, The Wall Street Journal).
RECORD PAYOUT – S&P 500 companies paid out a record $140.6 billion in dividends in the second quarter, according to S&P Dow Jones Indices. That’s up from $137.6 billion in the first quarter and up $123.4 billion in the same quarter last year. Annual dividend payouts have notched new highs every year for a decade, except for a slight decrease in 2020. Payments this year are projected to grow at a faster pace than usual, as companies have logged strong sales and are passing on a slice of the elevated profits to shareholders. Howard Silverblatt, senior index analyst at S&P Dow Jones Indices, estimates dividend payments will jump more than 10% in 2022 from last year’s record $511.2 billion, which would mark the first double-digit increase since 2014 (source: S&P Dow Jones Indices, The Wall Street Journal).
(NOT AS MUCH) PAIN AT THE PUMP – To the relief of combustible engine owners everywhere, gasoline prices are falling almost as quickly as they rose. Prices have fallen steadily for nearly a month now, and the average price of regular gasoline has dipped to about $4.63 a gallon, according to AAA. That is down about 6% since prices hit their highest point, $5.02, on June 14 (source: AAA, The Wall Street Journal).
This Week in History
READY, SET, JET – On July 15, 1916, a Yale-educated aeronautical engineer, incorporated Pacific Aero Products in Seattle with $100,000 in capital; he kept 998 of the original 1,000 shares of stock for himself. In 1917 William Boeing renamed his firm the Boeing Airplane. Of course, Boeing later made jet travel an accepted part of everyday life and is one of the two major manufacturers of 100-plus seat airplanes (source: The Wall Street Journal).
Asset Class Performance
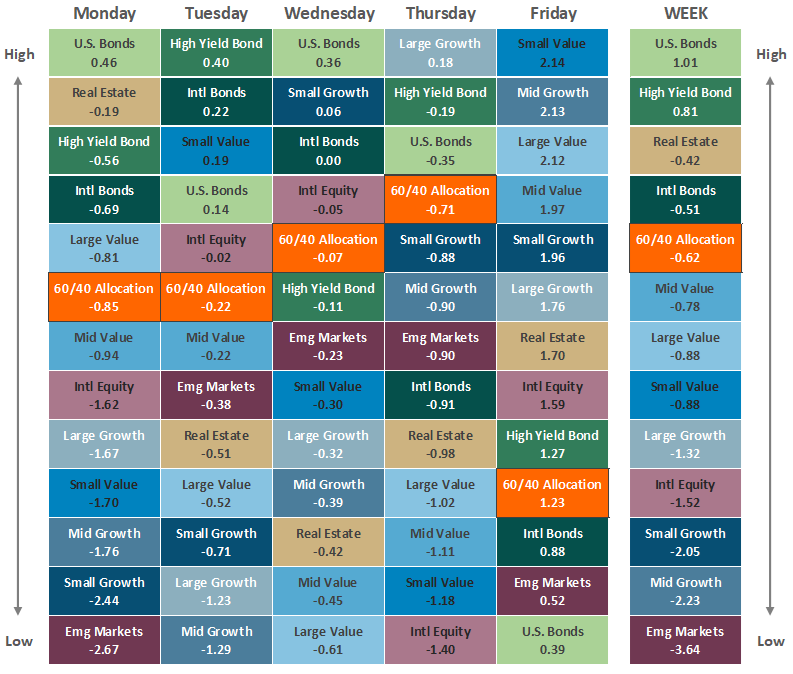
The Importance of Diversification. Diversification mitigates the risk of relying on any single investment and offers a host of long-term benefits, such as lowering portfolio volatility, improving risk-adjusted returns, and helping investments to compound more effectively.
Source: Bloomberg. Asset‐class performance is presented by using market returns from an exchange‐traded fund (ETF) proxy that best represents its respective broad asset class. Returns shown are net of fund fees for and do not necessarily represent the performance of specific mutual funds and/or exchange-traded funds recommended by The Retirement Planning Group. The performance of those funds may be substantially different than the performance of the broad asset classes and to proxy ETFs represented here. U.S. Bonds (iShares Core U.S. Aggregate Bond ETF); High‐Yield Bond (iShares iBoxx $ High Yield Corporate Bond ETF); Intl Bonds (SPDR® Bloomberg Barclays International Corporate Bond ETF); Large Growth (iShares Russell 1000 Growth ETF); Large Value (iShares Russell 1000 Value ETF); Mid Growth (iShares Russell Mid-Cap Growth ETF); Mid Value (iShares Russell Mid-Cap Value ETF); Small Growth (iShares Russell 2000 Growth ETF); Small Value (iShares Russell 2000 Value ETF); Intl Equity (iShares MSCI EAFE ETF); Emg Markets (iShares MSCI Emerging Markets ETF); and Real Estate (iShares U.S. Real Estate ETF). The return displayed as “Allocation” is a weighted average of the ETF proxies shown as represented by: 30% U.S. Bonds, 5% International Bonds, 5% High Yield Bonds, 10% Large Growth, 10% Large Value, 4% Mid Growth, 4% Mid Value, 2% Small Growth, 2% Small Value, 18% International Stock, 7% Emerging Markets, 3% Real Estate.
Chris Bouffard is CIO of The Retirement Planning Group (TRPG), a Registered Investment Adviser. He has oversight of investments for the advisory services offered through TRPG.
Disclaimer: Information provided is for educational purposes only and does not constitute investment, legal or tax advice. All examples are hypothetical and for illustrative purposes only. Past performance of any market results is no assurance of future performance. The information contained herein has been obtained from sources deemed reliable but is not guaranteed. Please contact TRPG for more complete information based on your personal circumstances and to obtain personal individual investment advice.


