Quick Takes
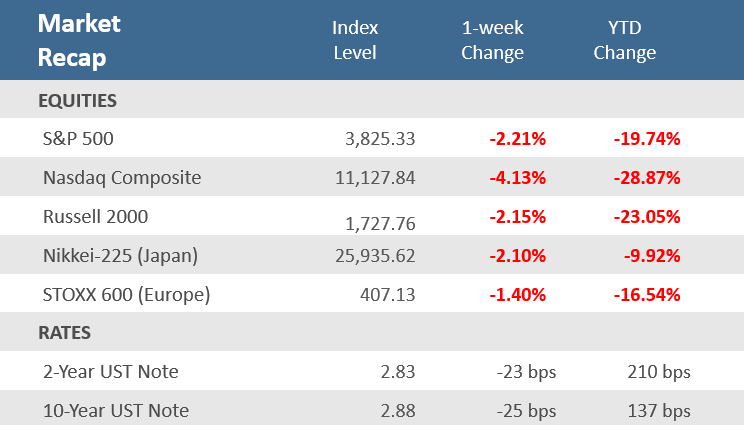
- Stocks fell for the fourth week in the last five as inflation and growth concerns continue to wear on investors. The S&P 500 and Russell 2000 fell -2.2%, while the Nasdaq finished lower by -4.1%. Growth stocks, the prior week’s leaders, were the laggards last week.
- Bond yields declined noticeably on weaker than expected economic data and decelerating, but still very elevated, inflation levels. The yield on the 10-year Treasury fell to 2.88% from 3.13% a week ago and the Bloomberg Aggregate Bond Index gained +1.3% for the week.
- Economic reports largely disappointed as the pace of U.S. manufacturing slowed, the final release of Q1 GDP contracted worse than initial reports, the Atlanta Fed’s GDP now tracker has second-quarter GDP also contracting, Consumer Confidence fell to levels not seen in over a year, and personal spending came in weaker than expected.
Markets fall again a inflation and growth concerns take hold
All of the major U.S. equity indices posted their fourth down week in the last five. The S&P 500 and Russell 2000 fell -2.2%, while the Nasdaq finished lower by -4.1%. Stocks dropped on the week as inflation pressures persisted, but now warning signs of a growth slowdown are also worrying investors. Global central banks have implemented 65 rate hikes in Q2-2022 (that’s counting multiple 25 basis point (bp) like the Federal Reserve’s recent 75 bp rate hike as a single hike) in an effort to restrain rampant inflation worldwide. For his part, this past week U.S. Federal Reserve Chairman Jerome Powell said he was more concerned about the risk of failing to stamp out high inflation than about the possibility of raising interest rates too high and pushing the economy into a recession. Indeed, the Fed is raising rates at the most aggressive pace since the 1980s to fight high inflation. Many are beginning to worry that the Fed’s aggressive stance will do exactly that. Economic reports this week showed that the pace of U.S. manufacturing slowed in June, the final release of Q1 GDP contracted at an annual rate of -1.6%, slightly worse than initial reports, the Atlanta Fed’s GDPnow tracker has second-quarter GDP at -2.1%, Consumer Confidence fell to levels not seen in over a year, and personal spending came in weaker than expected. However, inflation may have peaked, even as the Fed stays aggressive with its monetary policy stance. Late this past week, the Fed’s preferred inflation measure, the Core Personal Consumption Expenditures (PCE) price index, rose +0.3% in May, which was lower than expectations, and on a year-over-year basis, it slipped to +4.7% after topping out at +5.3% in February.
With the backdrop of decelerating inflation and slower than expected growth, U.S. Treasuries rallied, sending the yield on the 10-year note to 2.88% from 3.13% a week ago. Yields at the short-end of the curve moved noticeably lower, as the 2-year yield dropped almost as much as the 10-year and finished at 2.83%. As a result, the Bloomberg Aggregate Bond Index gained +1.3%, the only positive performance for the week among the major asset classes.
Chart of the Week
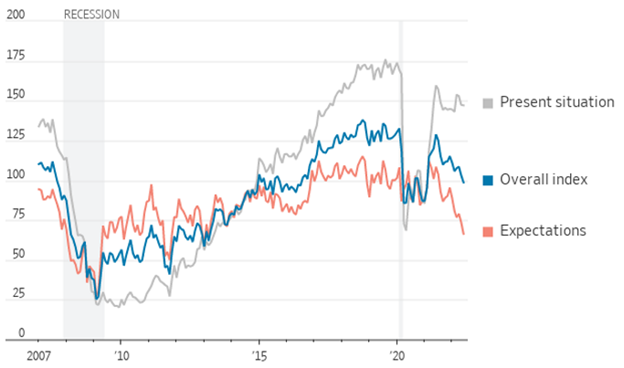
Concerns about inflation sent the Conference Board’s Consumer Confidence Index down sharply to 98.7 in June from 103.2 in May, below expectations for a drop to 100.0 and its lowest point in nearly a decade. The index points to Americans’ overall attitudes toward jobs and the economy. The Expectations Index of business conditions for the next six months component, which measures consumers’ near-term outlook about the labor market, business, and income, tumbled to 66.4, its lowest reading since March 2013—further evidence that inflation is weighing on households. The Present Situation Index portion of the survey declined to 147.1 from the previous month’s 147.4 level. On employment, the labor differential—consumers’ appraisal of jobs being “plentiful” minus being “hard to get”—increased slightly to 39.7 from the 39.5 level posted in May.
Consumer Outlook Weakens
Conference Board’s consumer-confidence index
Source: The Conference Board, The Wall Street Journal
Economic Review
- The final release (of three) for Q1-2022 Gross Domestic Product (GDP), the broadest measure of U.S. economic output, showed a quarter-over-quarter annualized rate of contraction of -1.6%, versus forecasts of remaining at the 1.5% decline reported in the second release. Q4’s figure was unadjusted at a 6.9% increase. Personal Consumption was revised markedly lower to +1.8% for Q1 from the previous estimate of a +3.1% gain and versus expectations to remain unrevised. On inflation, the GDP Price Index was revised higher to an +8.2% gain, versus expectations to be unrevised at +8.1%, and the Fed’s preferred inflation measure, the Core PCE Index, which excludes food and energy, was adjusted higher to +5.2%, versus expectations to remain at +5.1%.
- The June Institute for Supply Management (ISM) Manufacturing PMI Index expanded (a reading above 50) at a slower rate than expected, falling to 53.0 from 56.1 in May, under expectations of 54.5. New Orders fell into contraction while production growth accelerated slightly, along with inventories. The contraction in employment worsened, but supplier delivery times improved. Inflation pressures moderated but remained severely elevated, with prices paid decreasing to 78.5 from 82.2.
- The final June S&P Global U.S. Manufacturing PMI Index was revised higher to 52.7, versus expectations to remain at 52.4, and below May’s 57.0. S&P Global’s report differs from the ISM as it surveys a wider range of companies regarding size. S&P Global said, “The US manufacturing sector signaled subdued improvements in operating conditions during June. The headline PMI dropped to its lowest level since July 2020 amid a near-stagnation of factory output and a fall in new orders. The decrease in sales was the first since May 2020, with domestic and foreign client demand falling.”
- Construction Spending fell -0.1% in May, well below expectations of +0.4% and compared to April’s upwardly revised +0.8%. Residential spending rose +0.2%, while non-residential spending decreased -0.6%.
- May preliminary Durable Goods Orders were up +0.7% for the month, above expectations of +0.1% and April’s downwardly revised +0.4% increase. Orders for non-defense capital goods excluding aircraft, considered a proxy for business spending, were higher by +0.5%, above expectations of +0.2% rise, and versus the prior month’s downwardly revised +0.3% gain.
- May Personal Income was up +0.5% for the month, in line with expectations and April’s upwardly revised increase. Personal Spending was up +0.2%, below expectations of +0.4%, and the prior month’s downwardly revised +0.6% gain. The May savings rate as a percentage of disposable income was +5.4%, up from April’s upwardly revised +5.2% rate.
- May Pending Home Sales surprisingly rose by +0.7% for the month, ending six-months of declines, and beating expectations for a -4.0% decline and April’s negatively revised -4.0% decrease. For the year pending sales fell -12.0% following April’s unrevised -11.5% drop.
- The S&P CoreLogic Case-Shiller National Home Price Index, which measures average home prices in major metropolitan areas across the nation, rose +20.4% in the year that ended in April, down from +20.6% the prior month. A rapid increase in mortgage rates since the start of the year has made home-buying less affordable and pushed some buyers out of the market. But demand to purchase homes continues to exceed the limited inventory of homes for sale.
- Following declines in other regional Fed manufacturing gauges the prior week, the Dallas Fed Manufacturing Index dropped further into contraction territory (a reading below zero) for June. The index plunged to -17.7 from -7.3 in May, far below expectations for an improvement to -5.8. The decline came as growth in shipments and production output decelerated, and new orders dipped into negative territory for the first time in two years, while growth in employment also moved lower. Inflation pressures increased soundly and remain very elevated.
- Likewise, the June Richmond Fed Manufacturing Activity Index also fell deeper into contraction territory (a reading below zero), plunging to -19 from May’s -9 reading, and well below expectations for a reading of -7. New order volume and shipments dropped further into contraction territory, while prices paid decelerated but remained severely elevated.
- The June Chicago PMI slowed more than expected but remained in expansion territory (a reading above 50), falling to 56.0 from 60.3 in May, and below expectations for a decline to 58.0. New orders fell into contraction territory and production growth slowed, while employment moved back into expansion territory. Prices paid slowed but inflation remained extremely elevated.
- The weekly MBA Mortgage Application Index rose for a third straight week, up +0.7%, following the prior week’s increase of 4.2%. The Refinance Index rose +1.9% from last week and the Purchase Index was up +0.1% for the week. The gains came as the average 30-year mortgage rate slipped +14 basis point (bps) to 5.84% but is still up +264 bps from last year.
- Weekly Initial Jobless Claims were 231,000, for the week ended June 25, above expectations for 230,000, but below the prior week’s upwardly revised 233,000. Continuing Claims for the week ended June 18 were down 3,000 to 1,328,000, above expectations of 1,318,000.
The Week Ahead
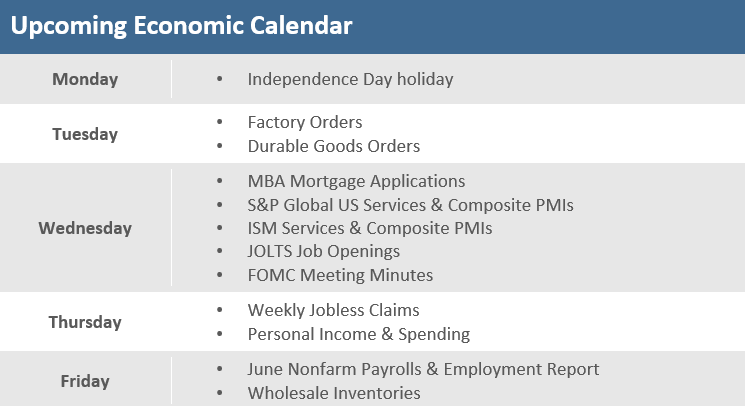
U.S. markets were closed Monday for the Independence Day holiday, leaving a shortened, but a busy week of economic reports. Notable reports include June reads on the ISM’s Services PMI, and S&P Global’s final Services PMI, the minutes from the Fed’s June FOMC monetary policy meeting, the job opening and labor turnover report (JOLTS) for May, and the headlining event of the week on Friday with the June nonfarm payroll report. Also, there will be some Federal Reserve members speaking, notably from notorious hawk St. Louis President James Bullard.
Did You Know?
STILL MADE SOME MONEY – The S&P 500 has suffered 2 “bear” markets since the beginning of the pandemic, i.e., in just the last 30 months. However, the S&P 500 has gained +17.3% (total return) from the close of trading on 2/19/2020 (at the peak for stocks before the first “bear” began) through last Friday 7/1/2022, 15 days after the second “bear” bottomed (source: BTN Research, Bloomberg).
HAS A REAL IMPACT – Every 1 percentage point increase in mortgage rates reduces property sales by 10%. The average rate on a 30-year fixed rate mortgage was 5.81% on 6/23/2022, up from 4.42% just 3 months earlier on 3/24/2022 (source: Federal Reserve Bank of New York, BTN Research).
WHAT THE FED DID THEN – Inflation, as measured by the “Consumer Price Index,” was up +13.3% in 1979 and up +12.5% in 1980. The Fed funds rate, 8.5% as of 6/05/1980, was increased by the Fed to 20.0% just 6 months later (12/05/1980) to bring inflation under control. Inflation was up +7.0% in 2021 and the Fed funds rate is 1.75% today after 3 Fed rate hikes already in 2022 (source: Federal Reserve, BTN Research).
This Week in History
TIME – On June 29, 1956, President Dwight D. Eisenhower, spurred on by memories of how easy it was for Allied troops to move along Germany’s autobahns in 1945, and how difficult it had been for an army convoy to cross the U.S. in 1919, signed the Federal-Aid Highway Act, creating the Interstate Highway System (source: The Wall Street Journal).
Asset Class Performance
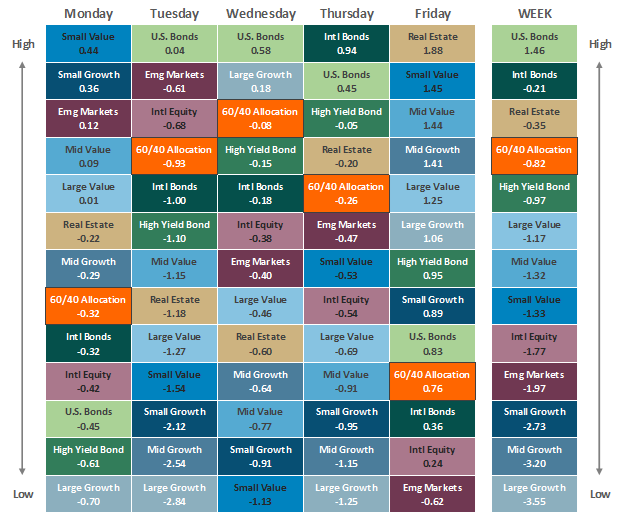
The Importance of Diversification. Diversification mitigates the risk of relying on any single investment and offers a host of long-term benefits, such as lowering portfolio volatility, improving risk-adjusted returns, and helping investments to compound more effectively.
Source: Bloomberg. Asset‐class performance is presented by using market returns from an exchange‐traded fund (ETF) proxy that best represents its respective broad asset class. Returns shown are net of fund fees for and do not necessarily represent the performance of specific mutual funds and/or exchange-traded funds recommended by The Retirement Planning Group. The performance of those funds may be substantially different than the performance of the broad asset classes and to proxy ETFs represented here. U.S. Bonds (iShares Core U.S. Aggregate Bond ETF); High‐Yield Bond (iShares iBoxx $ High Yield Corporate Bond ETF); Intl Bonds (SPDR® Bloomberg Barclays International Corporate Bond ETF); Large Growth (iShares Russell 1000 Growth ETF); Large Value (iShares Russell 1000 Value ETF); Mid Growth (iShares Russell Mid-Cap Growth ETF); Mid Value (iShares Russell Mid-Cap Value ETF); Small Growth (iShares Russell 2000 Growth ETF); Small Value (iShares Russell 2000 Value ETF); Intl Equity (iShares MSCI EAFE ETF); Emg Markets (iShares MSCI Emerging Markets ETF); and Real Estate (iShares U.S. Real Estate ETF). The return displayed as “Allocation” is a weighted average of the ETF proxies shown as represented by: 30% U.S. Bonds, 5% International Bonds, 5% High Yield Bonds, 10% Large Growth, 10% Large Value, 4% Mid Growth, 4% Mid Value, 2% Small Growth, 2% Small Value, 18% International Stock, 7% Emerging Markets, 3% Real Estate.
Chris Bouffard is CIO of The Retirement Planning Group (TRPG), a Registered Investment Adviser. He has oversight of investments for the advisory services offered through TRPG.
Disclaimer: Information provided is for educational purposes only and does not constitute investment, legal or tax advice. All examples are hypothetical and for illustrative purposes only. Past performance of any market results is no assurance of future performance. The information contained herein has been obtained from sources deemed reliable but is not guaranteed. Please contact TRPG for more complete information based on your personal circumstances and to obtain personal individual investment advice.


