Quick Takes
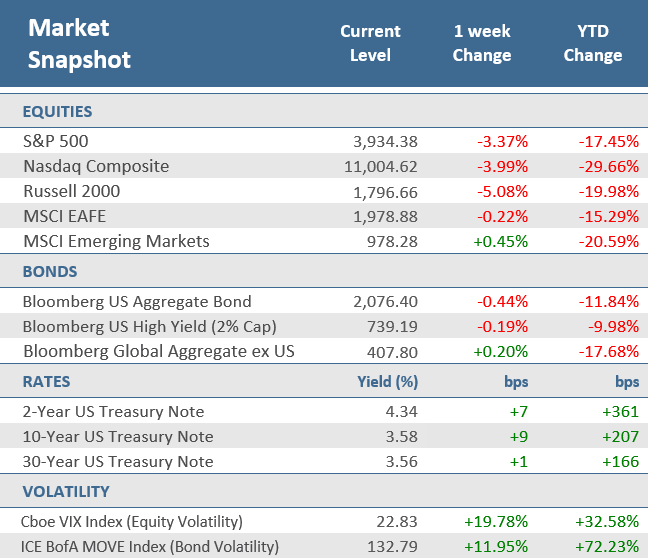
- U.S. stock broke a two-week rally, with the S&P 500 having its worst week since September. The tech-heavy Nasdaq Composite fell -4.0%, its worst week since early November. Losses were broad based with all 11 S&P 500 sectors down for the week.
- U.S. Treasurys also endured a bumpy week, with the 10-year yield ending nine basis points higher at 3.58% and the 2-year yield up 7 basis points to 4.34%. The Bloomberg U.S. Aggregate Bond Index slipped -0.4% for the week.
- Investors were disappointed by a higher than expected Producer Price Index (PPI), which rose in November from a year earlier by the smallest annual increase since May 2021 but was hotter than what economists were expecting (a +7.2% rise).
Stocks and bonds end two-week winning streak
U.S. stocks and bonds posted their first losses in three weeks. Investors were hoping for signs of easing inflation before the Federal Reserve’s rate decision coming up this Wednesday but were disappointed when producer prices came in hotter than expected on Friday. The Producer Price Index (PPI), which generally reflects supply conditions in the economy, rose +7.4% in November from a year earlier, which was the smallest annual increase since May 2021 and was actually down from October’s annual rate of +8.1%. However, economists were only expecting PPI to rise +7.2%, indicating that price pressures may not be easing enough to convince the Fed to pivot to a less aggressive monetary policy ahead of next week’s meeting. The Fed has delivered four 75-basis point increases to its benchmark rate and is widely expected to raise rates by another 50 basis points next week.
For the S&P 500 and Russel 2000 (small caps), it was the worst week since September, with the indexes down -3.4% and -5.1% respectively. The tech-heavy Nasdaq Composite fell -4.0%, its worst week since early November. The losses were broad based with all 11 S&P 500 sectors down for the week, with Energy getting hit hardest with a -8.5% drop. Non-U.S. stocks outperformed their domestic counterparts as the MSCI EAFE Index slipped -0.2% for the week, and Emerging Markets managed to eke out a +0.5% gain.
U.S. Treasurys also endured a bumpy week, with the 10-year yield ending nine basis points higher at 3.58%, and the 2-year yield was up 7 basis points to 4.34%. As a result, the Bloomberg U.S. Aggregate Bond Index slipped -0.4% for the week, but non-U.S. bonds gained with the Bloomberg Global Aggregate Bond Index ex U.S. up +0.2%.
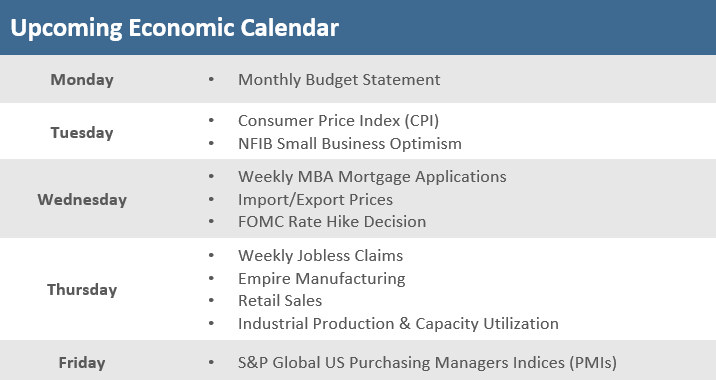
Investors are mostly in wait-and-see mode for next Tuesday’s report on U.S. consumer inflation—the Consumer Price Index (CPI)—to see if inflation has receded and then the Federal Reserve’s rate decision on Wednesday to see if a pivot to slower and lower rate hikes is coming. At least fuel costs are lower. According to AAA, crude oil and gasoline prices are now lower than a year ago, with regular averaging $3.32 a gallon versus $3.34 a year ago.
Chart of the Week
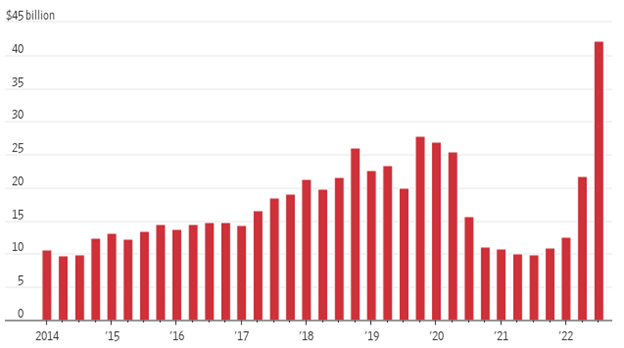
Americans are forsaking billions of dollars in interest income by keeping their savings at the biggest U.S. banks. The Federal Reserve has raised interest rates to their highest level since early 2008, yet the biggest commercial banks are still paying peanuts to customers in savings accounts. U.S. savers could have earned $42 billion more in interest in the third quarter if they moved their money out of the five largest U.S. banks by deposits to the five highest-yield savings accounts—none of which are offered by the big banks.
The $42 Billion Question
Bars indicate how much more money Americans would have earned by holding funds in a top high-yield savings account each quarter
Source: S&P Global Market Intelligence, The Wall Street Journal.
Economic Review
- November wholesale inflation was hotter than anticipated with the Producer Price Index (PPI) +7.4% higher than the prior year. That was down from October’s annual +8.1% rise and was the smallest annual increase since May 2021, but still above expectations for a +7.2%. PPI peaked at +11.7% back in March. For the month PPI was up +0.3%, above expectation for +0.2%, and matching the upwardly revised October gain. Core PPI—which excludes food and energy—was up +6.2% from last year, above expectations of +5.9%, and October’s upwardly revised +6.8%. Month-over-month, Core PPI was +0.4%, double expectations of +0.2%, and higher than the prior month’s upwardly revised +0.1% gain.
- The preliminary University of Michigan Consumer Sentiment Index for December increased more than expected, rising to 59.1 from 56.8 in November, beating expectations for a slight increase to 57.0. The index continued to move off the record low seen in June, as both the current conditions portion of the index and the expectations component of the report rose. The 1-year inflation forecast declined to 4.6% from 4.9% in November, and the 5-10-year inflation outlook remained at the prior month’s 3.0% rate.
- The November Institute for Supply Management (ISM) Services Index unexpectedly accelerated further into growth territory (a reading above 50), rising to 56.5 from October’s 54.4, and well above expectations for a decline to 53.5. Business activity jumped above the 60 level, and employment also expanded. Prices slipped but remained elevated at 70.0.
- In contrast, the final read on the competing S&P Global U.S. Services PMI Index was revised slightly higher in November but remained in contraction territory (a reading below 50). The index was revised up slightly to 46.2, versus expectations to remain at the preliminary 46.1 reading. The services PMI was below October’s 47.8 level, marking the fifth consecutive month of declining services activity and the weakest level going back to August.
- October Factory Orders rose +1.0% for the month, beating expectations of +0.7%, and well above the prior month’s unrevised +0.3% rise. Durable Goods Orders—preliminarily reported two weeks ago—was adjusted higher to a +1.1% gain from the previously reported +1.0%, where it was expected to remain. October’s final read on nondefense capital goods orders excluding aircraft—considered a proxy for capital spending—was downwardly revised to a +0.6% monthly gain from a +0.7% rise in the preliminary reading.
- U.S. Household Net Worth contracted by -$392 billion in 3Q-2022, after falling a record -$6.3 trillion in Q2-2022. For 2022, cumulative net worth is down -$6.8 trillion through the third quarter with equity holdings leading the way down. In the Global Financial Crisis, net worth fell a cumulative -$11.4 trillion over six quarters.
- The Trade Balance deficit for October widened less than expected, coming in at a 5.4% expansion to $78.2 billion, versus September’s negatively revised deficit of $74.1 billion, and below expectations for $80.0 billion. Exports declined -0.7% and imports increased 0.6%.
- The weekly MBA Mortgage Application Index fell -1.9% from the prior week’s -0.8% fall as the Refinance Index was up +4.7% while the Purchase Index fell -3.0% for the week. The decrease came as the average 30-year mortgage rate fell for the fourth week in a row, down -8 bps to 6.41%, which is up 3.11 percentage points versus a year ago.
- Weekly Initial Jobless Claims fell by 4,000 to 230,000 for the week ended December 3, below expectations for 235,000 and the prior week’s upwardly revised 241,000. Continuing Claims for the week ended November 26 rose by 62,000 to 1,671,000, higher than expectations of 1,618,000.
The Week Ahead
Key inflation data will be on tap for next week, especially the Consumer Price Index (CPI) on Tuesday, Import Prices on Wednesday, and of course, perhaps the marquee event on the economic calendar—the Federal Open Market Committee’s (FOMC) monetary policy decision on Wednesday afternoon. Investors will also be watching November retail sales, as well as industrial production and capacity utilization on Thursday. Friday brings a look at business activity courtesy of the preliminary December manufacturing and services PMIs from S&P Global.
Did You Know?
GAS RELIEF – Motorists are finally getting some relief at the gas pump. The U.S. average for regular unleaded gasoline has declined to $3.32 a gallon, below its average of $3.36 from last year and down about -35% from its peak of about $5 earlier in the year, when the war in Ukraine disrupted supplies and boosted prices for raw materials from copper to corn to diesel (Source: The Wall Street Journal).
#AIRBNBUST – Vacation-rental owners across the U.S. have taken to social media to lament that their bookings have come to a screeching halt, punctuating their disquietude with #Airbnbust, a hashtag that went viral this fall. Their problem isn’t demand. The number of bookings has risen, but there has also been a sharp rise in the supply of available short-term rental listings. The causes likely include a slowing housing market—home-owners are renting rather than selling—as well as financial strains caused by rising inflation, and other factors (source: The Wall Street Journal).
BAH HUMBUG – 27% of U.S.-based companies won’t award year-end bonuses this year, according to a survey by the outplacement and executive coaching firm Challenger, Gray & Christmas. That’s up from 23% in 2021 (source: The Wall Street Journal).
This Week in History
COMPUTER BUG – On December 9, 1906, Grace Murray Hopper (maiden name Grace Brewster Murray) was born in New York City. She invented the COBOL computer language, one of the first software programs enabling computers to be used by non-mathematicians. She also coined the term “bug” for an electronic glitch when, in 1945, she captured a moth that had been fluttering around inside a computer and causing electrical relays to fail (source: The Wall Street Journal).
Asset Class Performance
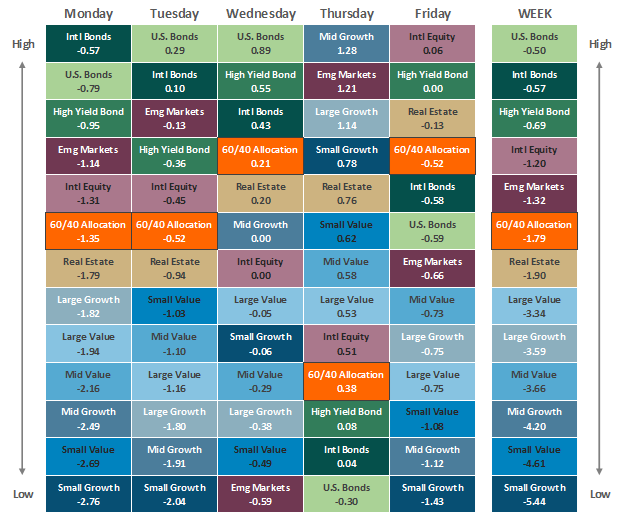
The Importance of Diversification. Diversification mitigates the risk of relying on any single investment and offers a host of long-term benefits, such as lowering portfolio volatility, improving risk-adjusted returns, and helping investments to compound more effectively.
Source: Bloomberg.
Asset‐class performance is presented by using market returns from an exchange‐traded fund (ETF) proxy that best represents its respective broad asset class. Returns shown are net of fund fees for and do not necessarily represent performance of specific mutual funds and/or exchange-traded funds recommended by The Retirement Planning Group. The performance of those funds may be substantially different than the performance of the broad asset classes and to proxy ETFs represented here. U.S. Bonds (iShares Core U.S. Aggregate Bond ETF); High‐Yield Bond (iShares iBoxx $ High Yield Corporate Bond ETF); Intl Bonds (SPDR® Bloomberg Barclays International Corporate Bond ETF); Large Growth (iShares Russell 1000 Growth ETF); Large Value (iShares Russell 1000 Value ETF); Mid Growth (iShares Russell Mid-Cap Growth ETF); Mid Value (iShares Russell Mid-Cap Value ETF); Small Growth (iShares Russell 2000 Growth ETF); Small Value (iShares Russell 2000 Value ETF); Intl Equity (iShares MSCI EAFE ETF); Emg Markets (iShares MSCI Emerging Markets ETF); and Real Estate (iShares U.S. Real Estate ETF). The return displayed as “Allocation” is a weighted average of the ETF proxies shown as represented by: 30% U.S. Bonds, 5% International Bonds, 5% High Yield Bonds, 10% Large Growth, 10% Large Value, 4% Mid Growth, 4% Mid Value, 2% Small Growth, 2% Small Value, 18% International Stock, 7% Emerging Markets, 3% Real Estate.
* The term basis points (bps) refers to a common unit of measure for interest rates and other percentages in finance. One basis point is equal to 0.01%. Bond prices and bond yields are inversely related. As the price of a bond goes up, the yield decreases.


