Quick Takes
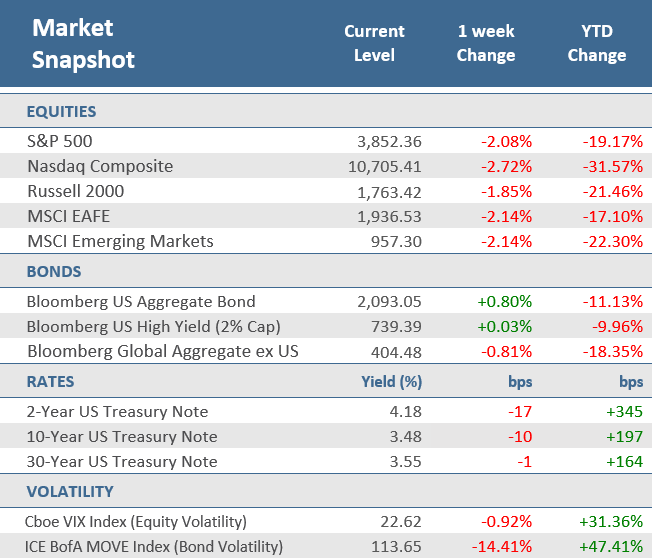
- Stocks suffered a second week of losses, despite getting off to a solid start. The S&P 500 shed -2.1%, the tech-heavy Nasdaq Composite fell -2.7%, and the small cap Russel 2000 was down -1.9%. Developed international and emerging market stocks both fell -2.1%.
- Treasury yields slid during the week, with the 10-year yield down 10 bps to 3.48% and the 2-year yield fell 17 bps to 4.18%. The Bloomberg U.S. Aggregate Bond Index was up +0.8% for the week, but the Bloomberg Global Aggregate Bond Index ex U.S. fell -0.8%.
- Consumer inflation was lower than expected at a +7.1% annual rate and the Federal Open Market Committee (FOMC) hiked the fed funds rate by 50 basis points (bps). But the FOMC’s outlook for interest rates in the future came in higher than expected, sending markets lower.
Stocks fall on hawkish Fed outlook and sluggish economic data
Stocks suffered a second week of losses, despite getting off to a solid start. Stocks went up sharply in the first trading session of the week as investors were anticipating a tamer Consumer Price Index (CPI) on Tuesday. And CPI did indeed come in softer-than-expected giving stocks a second day of gains. But that was about it for the upside for the week. The optimism of a less-aggressive stance by the Fed in the near term, quickly dissipated following the Federal Open Market Committee (FOMC) decision to hike the target for the fed funds rate with a 50 basis points (bp) increase. That was widely expected and represented a welcomed departure from the 75-bp increases over the prior four meetings, but the FOMC’s outlook for interest rates in the future came in higher than expected, now indicating a peak rate of 5.1%. The prospect of interest rates staying higher for longer, and the potential for an economic slowdown, sent stocks lower on Wednesday, Thursday, and Friday. For the week, the S&P 500 shed -2.1%, and the tech-heavy Nasdaq Composite fell -2.7%, while the small cap Russel 2000 weathered the week a little better with a -1.9% decline. Ten of eleven S&P 500 sectors fell for the week, with Energy getting the only group with a gain.
Non-U.S. stocks were also pressured. The European Central Bank, the Bank of England, and the Swiss National Bank all followed the Fed with their own 50-bp increases, continuing aggressive policy globally in the battle to tame inflation pressures. The Bank of Mexico also raised its benchmark interest rate by a half percentage point Thursday. The MSCI EAFE Index and the MSCI Emerging Markets Index both fell -2.1% for the week.
As interest rates were raised around the world, economic data are increasingly signaling mounting recession concerns. During the week, manufacturing and services PMIs in the U.S. and overseas continued to depict sluggishness in the global economy. Meanwhile, retail sales fell more than expected, industrial production surprisingly declined, and New York and Philadelphia regional manufacturing activity data disappointed.
U.S. Treasury yields slid during the week, with the 10-year yield down ten basis points to 3.48% and the 2-year yield fell 17 basis points to 4.18%. As a result, the Bloomberg U.S. Aggregate Bond Index gained +0.8% for the week. However, non-U.S. bonds couldn’t keep up as the Bloomberg Global Aggregate Bond Index ex U.S. fell -0.8%.
Chart of the Week
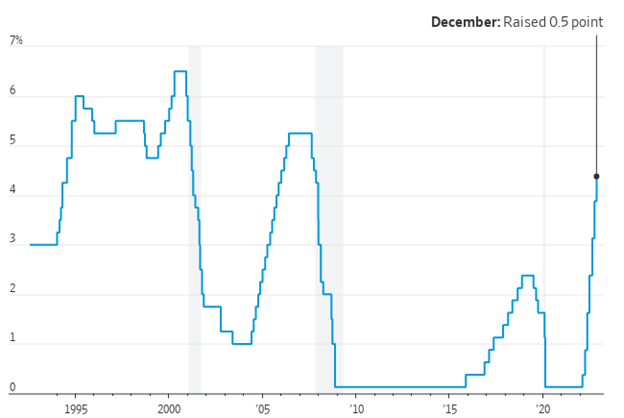
On Wednesday the Federal Open Market Committee (FOMC) concluded its two-day monetary policy meeting, raising the target for the fed funds rate by 50 bps to a range of 4.25% to 4.50% as widely expected to combat high inflation. The Fed signaled plans to lift rates through the spring, though likely in smaller increments. The latest hike marked a step down after four consecutive increases of 0.75 point and raised the benchmark federal-funds rate to a range between 4.25% and 4.5%, a 15-year high. In its statement, the Committee noted that spending and production have indicated modest growth, job gains remain robust, and the unemployment rate continues to be low. However, inflation remains elevated, citing supply and demand imbalances related to the pandemic and higher energy and food prices. Regarding its balance sheet, the Fed said it will maintain its plans of reducing its holdings of Treasury securities and agency debt and agency mortgage-backed securities that it released in May. Most Fed officials penciled in plans to raise the rate to between 5% and 5.5% in 2023, with the median projection implying a further 0.75 percentage point in rate increases. Wednesday’s hike capped a year in which the Fed raised rates at the fastest pace since the early 1980s to fight inflation, which is running near 40-year highs. Fed policymakers are entering a new phase of policy tightening in which they are trying to determine just how high to raise rates. Fed Chair Jerome Powell said it was “broadly right” that slowing rate rises to more traditional quarter-percentage-point increments as soon as the Fed’s next meeting would provide the best way to manage the risk of over-tightening.
Fed Raises Rates, Signals More Hikes Likely
Federal-funds target rate
Note: The chart shows the midpoint of the range since 2008.
Source: Federal Reserve, The Wall Street Journal.
Economic Review
- The November Consumer Price Index (CPI) rose +7.1% higher from last year, below expectations for a rise of +7.3% from the prior month’s unrevised +7.7% rate. Core PPI, which strips out food and energy, was up +6.0% for the year, also below expectations, which called for a +6.1% gain, and below September’s unadjusted 6.3% rise. Month-over-month headline CPI was up +0.1%, below expectations of a +0.3%, and below October’s unrevised +0.4% increase. Core PPI was up +0.2%, below expectations for it to match October’s +0.3% rise. The Bureau of Labor Statistics (BLS) said the index for shelter was by far the largest contributor to the increase, and more than offset the decreases in energy. Gasoline and electricity prices both declined, as did utility gas services.
- The Import Price Index fell -0.6% for the month of November, a bigger drop than the expected -0.5% decline and last month’s downwardly revised -0.4% decrease. Year-over-year, prices were up by +2.7%, lower than October’s negatively revised +4.1% rise, and below expectations for a +3.2% increase.
- The National Federation of Independent Business (NFIB) Small Business Optimism Index for November unexpectedly rose to 91.9, beating expectations for a decline to 90.4, and above October’s 91.3. According to the report, 32% of small business owners noted that inflation was their single most important problem in operating their business. The NFIB noted, “Going into the holiday season, small business owners are seeing a slight ease in inflation pressures, but prices remain high. The small business economy is recovering as owners manage an ongoing labor shortage, supply chain disruptions, and historic inflation.”
- Advance Retail Sales were down -0.6% in November, well below expectations of -0.2% and October’s unrevised +1.3% gain. Last month’s sales ex-autos declined -0.2%, in line with expectations, and October was downwardly revised to a +1.2% gain. Sales ex-autos and gas also dipped -0.2%, below expectations to be flat, and down from October’s downwardly revised +0.8%. The control group, a component used to calculate GDP, also fell -0.2%, under expectations for a +0.1% gain, and down from the prior month’s downwardly revised +0.5%.
- The preliminary December S&P Global U.S. Manufacturing PMI Index remained in contraction territory (a reading below 50), dropping to 46.2 from November’s unrevised 47.7 figure, missing expectations for a slight uptick to 47.8. The preliminary S&P Global U.S. Services PMI Index also deteriorated and fell further into contraction terrain, dropping to 44.4, missing expectations of a modest gain to 46.5 and down from November’s 46.2.
- November Industrial Production fell -0.2%, missing the expectation for a flat reading, and below October’s unrevised -0.1%. Manufacturing and mining output both fell, more than offsetting a jump in utilities consumption. Capacity Utilization fell to 79.7%, just missing expectations for a dip to 79.8% from the prior month’s unrevised 79.9%, but remains near its long-run average.
- The December Empire State Manufacturing Index, a measure of activity in the New York region, fell back into contraction territory (a reading below zero) with a drop to -11.2 from November’s +4.5, and far under expectations for a move to -1.0.
- The December Philly Fed Manufacturing Business Outlook Index improved but remained deeper in contraction territory (a reading below zero) than expected for December. The index increased to -13.8 from November’s -19.4 level, missing expectations of -10.0.
- The weekly MBA Mortgage Application Index rose +3.2% from the prior week’s -1.9% fall as the Refinance Index was up +2.8% while the Purchase Index was up +4.0% for the week. The increase came as the average 30-year mortgage rate ticked up +1 basis point to 6.42%, which is up 3.12 percentage points versus a year ago.
- Weekly Initial Jobless Claims fell by -20,000 to 211,000 for the week ended December 10, below expectations for 232,000 and the prior week’s upwardly revised 231,000. Continuing Claims for the week ended December 3 rose by 1,000 to 1,671,000, under expectations of 1,674,000.
The Week Ahead
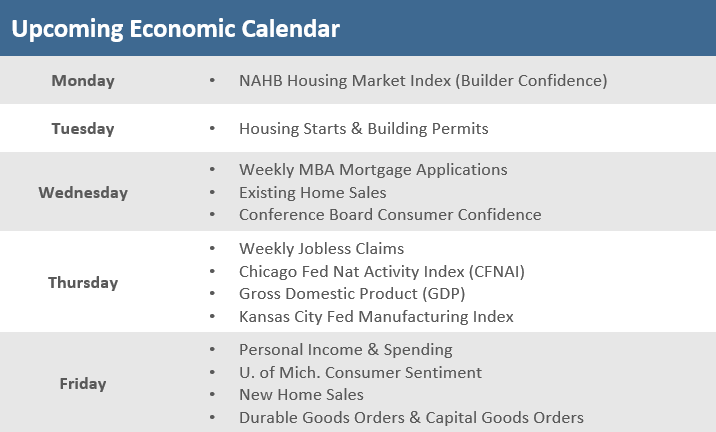
Housing data will be heavy in the coming week, starting with homebuilder confidence on Monday, courtesy of the NAHB Housing Market Index for December. Tuesday brings housing starts and building permits, and then the weekly MBA Mortgage Applications and existing home sales on Wednesday. Finally, new home sales are reported Friday. The third, and final, print for Q3 GDP is slated for Wednesday. The consumer will also be in focus, with the Conference Board’s Consumer Confidence Index, personal income and spending, as well as the final University of Michigan Consumer Sentiment Index for December all on the calendar for the week.
Did You Know?
EXPECTING RELIEF – Investors’ expectations for annual inflation over the next 10 years, derived from the gap between nominal and inflation protected securities, is currently around 2.16%, down from a recent peak of 2.42% on Dec. 2. To an extent, this reflects optimism about easing inflation, but it also reflects worries about a cooling economy (source: Tradeweb, The Wall Street Journal).
CAREGIVING COSTS – In 2021, family caregivers in the U.S. provided a total of around $470 billion in unpaid care. More than three in four family caregivers (78%) incurred out-of-pocket costs as a result of caregiving. The average out-of-pocket expenses for family caregivers totaled $7,242. On average, family caregivers spent 26% of their income on caregiving activities (Source: AARP, MFS).
OLDIES BUT GOODIES – Eight of the 10 holiday films most watched by U.S. households between Nov. 8 and Dec. 11 were considered classic Christmas movies. Star-Studded new Christmas movies still can’t beat the classics. Neither of the two released this season, Netflix’s “Falling for Christmas” and “The Noel Diary,” attracted even half the households that tuned in to the top movies, 1989’s “National Lampoon’s Christmas Vacation,” 1990’s “Home Alone” and 2003’s “Elf” (source: Samba TV, The Wall Street Journal).
This Week in History
ROAD WORK – On December 16, 1685, under orders from the British Governor General, workmen finished laying out a 36-foot-wide street of stone and dirt in lower Manhattan. The thoroughfare, which ran along a wall, was naturally named Wall Street (source: The Wall Street Journal).
Asset Class Performance
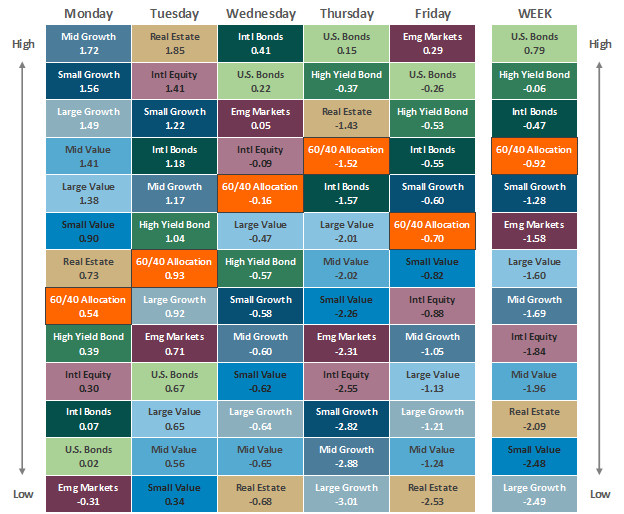
The Importance of Diversification. Diversification mitigates the risk of relying on any single investment and offers a host of long-term benefits, such as lowering portfolio volatility, improving risk-adjusted returns, and helping investments to compound more effectively.
Source: Bloomberg.
Asset‐class performance is presented by using market returns from an exchange‐traded fund (ETF) proxy that best represents its respective broad asset class. Returns shown are net of fund fees for and do not necessarily represent performance of specific mutual funds and/or exchange-traded funds recommended by The Retirement Planning Group. The performance of those funds may be substantially different than the performance of the broad asset classes and to proxy ETFs represented here. U.S. Bonds (iShares Core U.S. Aggregate Bond ETF); High‐Yield Bond (iShares iBoxx $ High Yield Corporate Bond ETF); Intl Bonds (SPDR® Bloomberg Barclays International Corporate Bond ETF); Large Growth (iShares Russell 1000 Growth ETF); Large Value (iShares Russell 1000 Value ETF); Mid Growth (iShares Russell Mid-Cap Growth ETF); Mid Value (iShares Russell Mid-Cap Value ETF); Small Growth (iShares Russell 2000 Growth ETF); Small Value (iShares Russell 2000 Value ETF); Intl Equity (iShares MSCI EAFE ETF); Emg Markets (iShares MSCI Emerging Markets ETF); and Real Estate (iShares U.S. Real Estate ETF). The return displayed as “Allocation” is a weighted average of the ETF proxies shown as represented by: 30% U.S. Bonds, 5% International Bonds, 5% High Yield Bonds, 10% Large Growth, 10% Large Value, 4% Mid Growth, 4% Mid Value, 2% Small Growth, 2% Small Value, 18% International Stock, 7% Emerging Markets, 3% Real Estate.
* The term basis points (bps) refers to a common unit of measure for interest rates and other percentages in finance. One basis point is equal to 0.01%. Bond prices and bond yields are inversely related. As the price of a bond goes up, the yield decreases.


