Quick Takes
- Friday’s blowout July payrolls report trounced expectations and challenges the notion that the U.S. is in recession—despite back-to-back quarters of negative GDP growth. The U.S. added 528,000 jobs in July, more than twice as many as the expected 258,000. The unemployment rate fell to 3.5%, matching the lowest level in five decades.
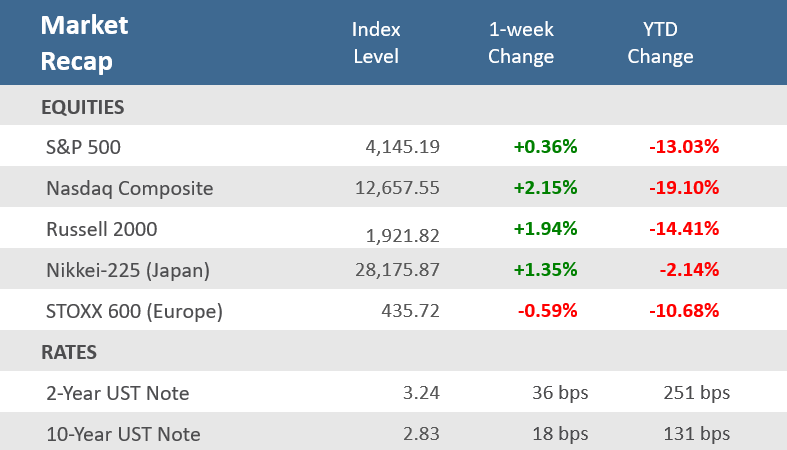
- The S&P 500, Nasdaq and Russell 2000 were up +0.4%, 2.2%, and +1.9%, respectively. For the S&P and Nasdaq, it was the third straight week of gains, their longest weekly winning streaks since April. They’re now all up in five of the last seven weeks.
- Treasuries yields surged following Friday’s strong jobs report, with the 2-year Treasury yield rising to 3.24% from 2.88% the prior Friday, and the 10-year yield rose to 2.83% from 2.65% the prior week. The Bloomberg U.S. Aggregate Bond Index fell -1.0% for the week.
Stocks hit 3-week streak, bonds break 3-week streak
Friday’s blowout July payrolls report trounced expectations and challenges the notion that the U.S. is in recession—despite back-to-back quarters of negative GDP growth. The U.S. added 528,000 jobs in July, more than twice as many as the expected 258,000. The unemployment rate fell to 3.5%, matching the lowest in five decades. The much better than expected jobs result poses a conundrum for investors. While a strong labor market can help support the economy, paradoxically a healthy employment market also empowers the Federal Reserve to keep hiking rates to tame inflation. Indeed, following the robust job numbers, by Friday afternoon markets were pricing in about a 69% chance that the Fed will enact a third straight 0.75-percentage point interest rate hike when it meets again in September. Prior to the report, the fed funds futures market was assigning only a 34% probability of another 75-percentage point rate hike.
The jobs data suggest that a dovish Fed pivot is unlikely any time soon the S&P 500 and Nasdaq fell Friday. Nevertheless, stocks were able to follow the best July of the post-WWII era with gains in the first week of August. The S&P 500, Nasdaq and Russell 2000 were up +0.4%, 2.2%, and +1.9%, respectively. For the S&P and Nasdaq, it was the third straight week of gains, their longest weekly winning streaks since April. They’re now all up in five of the last seven weeks.
Treasuries fell and yields surged following the jobs report, with the yield on the 2-year Treasury note rising to 3.24% from 2.88% the prior Friday, and the 10-year yield moved up to 2.83% from 2.65% at the close last week. The surge in short-maturity yields briefly saw the two-year Treasury yield 44 basis points higher than the 10-year yield, a degree of inversion last seen in 2000. With yields jumping and the yield curve further inverting, bond returns suffered. The Bloomberg U.S. Aggregate Bond Index fell -1.0% for the week, breaking a 3-week streak of gains. It was only the second negative week in the last seven for the broad market bond index.
Earnings season is winding down with 86% of S&P 500 companies having reported Q2-2022 profits. According to FactSet, blended earnings per share (which combines reported data with estimates for those that have yet to report) shows that earnings growth is running at 6.8% while sales rose about 13.6% compared with the same quarter a year ago. Earnings growth is running slightly behind Q1’s pace while sales growth is slightly faster than last quarter. Still, Q2 earnings have been better than expected and the past week saw the number of positive earnings surprises, as well as the magnitude of those earnings surprises, continue to rise.
Chart of the Week
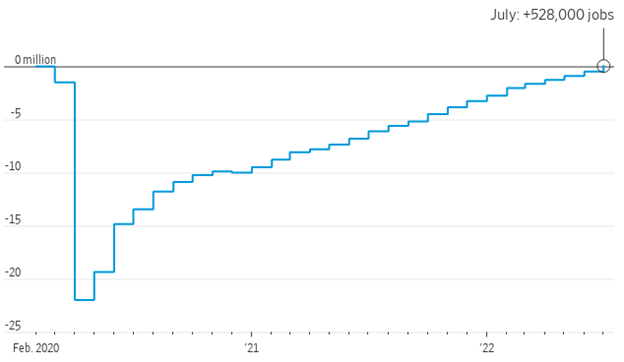
U.S. companies grew Nonfarm Payrolls by 528,000 in July and the jobless rate fell to match a half-century low of just 3.5%. The payroll results blew away expectations for a 250,000 rise and was a significant increase over June’s results, which were revised higher to 398,000 from the initial release of 372,000. The additional July payrolls also put payrolls above their February 2020 pre-pandemic level. The Bureau of Labor Statistics (BLS) said job growth was widespread, led by gains in leisure and hospitality, professional and business services, and health care. The Unemployment Rate slid to 3.5% from June’s 3.6% level, which was expected to remain. The Long-term Unemployed, persons unemployed for 27 weeks or more, accounted for 18.9% of the unemployed, which is back to its February 2020 pre-pandemic level and down from 22.6% in June. The U6 Unemployment Rate, which accounts for unemployed and underemployed workers, held steady at 6.7%. Average Hourly Earnings were up +0.5% for the month, above expectations for +0.3%, and June’s upwardly revised +0.4%. Compared to last year, wages were +5.2% higher, above expectations of +4.9%, and in line with June’s upwardly revised gain. Average Weekly Hours remained at June’s 34.6 rate, above expectations for 34.5. The only downside in the report was that the Labor Force Participation Rate dipped to 62.1% from June’s unrevised 62.2%, which was expected to remain. A key takeaway from the report is that the surprisingly strong jobs gains will definitely stir the recession debate. For months, strong employment growth has diverged with sluggish economic activity such as Gross Domestic Product (GDP), falling Purchasing Manager Indices (PMIs), decelerating Leading Economic Indicators (LEIs), and historically low sentiment indicators. But if hiring and wage gains remain strong it squashes the notion that the Fed can meaningfully slow rate hikes and aggressive monetary policy anytime soon.
July Jobs Bonanza Returns Payrolls to Pre-Pandemic Levels
U.S. nonfarm payrolls, change since February 2020
Source: Labor Department, The Wall Street Journal.
Economic Review
- The July Institute for Supply Management (ISM) Manufacturing Purchasing Managers Index (PMI) hit its lowest level since June 2020, falling to 52.8 from June’s 53.0 level, but beat expectations for a decline to 52.0. The better-than-expected results came despite new orders falling further into contraction, signaling declining demand for factory products. Production growth remained in expansion territory, and inventories expanded. The contraction in employment improved, and supplier delivery times shortened. Inflation pressures eased sharply but remained historically elevated, with the Prices Index falling to 60.0 from 78.5. The ISM index, based on a poll of manufacturers across the U.S., said businesses are “now expressing concern about a softening in the economy, as new order rates contracted for the second month amid developing anxiety about excess inventory in the supply chain.” A reading above 50 indicates that factory activity is expanding while a reading below 50 signals contraction.
- The July ISM Services PMI unexpectedly accelerated further into expansion levels with a rise to 56.7, from 55.3 in June, and much better than expectations for a decrease to 53.5. The acceleration suggests the key services segment of the economy is still growing despite signs of a broader slowdown. New orders and business activity grew, along with employment month-over-month. Meanwhile, inventories declined and continued to contract, and prices paid decreased solidly from the prior month but remained historically elevated.
- The final July S&P Global U.S. Manufacturing PMI Index was unexpectedly revised lower to 52.2 from the 52.3 level where it was expected to remain. The index was below June’s reading of 52.7. The S&P Global report differs from the ISM in that it surveys a more diverse range of companies regarding size.
- The final July S&P Global Services PMI Index was revised higher to 47.3 from the preliminary 47.0 level, where it was expected to remain, but remained in contraction territory, and was below June’s reading of 52.7.
- June Construction Spending fell -1.1% for the month, well below expectation for a +0.1% gain and below May’s upwardly revised +0.1%. Residential spending dropped -1.6%, while non-residential spending decreased -0.5%.
- June Factory Orders increased +2.0% in the month, above expectations of +1.2%, and the prior month’s +1.8%, which was revised higher from +1.6%. Shipments of manufactured goods rose +1.1% after increasing +2.1% in May. Durable Goods Orders—preliminarily reported last week—were revised up to +2.0% for June. Nondurable Goods Orders also jumped +2.0% for the month of June after increasing +2.7% in May. The increasing pace of order activity is another challenge to the view that the U.S. economy is in recession.
- Job openings continued their recent downtrend in June. The Labor Department’s Job Openings and Labor Turnover Survey (JOLTS), a measure of unmet demand for labor, showed a decrease to 10.7 million in the jobs available to be filled, down from May’s upwardly revised 11.3 million. Expectations were 11.0 million. The Hiring Rate slipped to 4.2% from 4.3% in May, and Separations held at May’s 3.9%. The Quit Rate also remained at May’s 2.8%.
- The weekly MBA Mortgage Application Index rose +1.2% following the prior week’s -1.8% decline, snapping a four-week streak of declines. The Refinance Index was up +1.5% from last week and the Purchase Index was up +1.0% for the week. The rebound came as the average 30-year mortgage rate fell 31 basis points to 5.34% but is still up +246bps from last year.
- Weekly Initial Jobless Claims were 260,000, for the week ended July 30, matching expectations, and higher than the prior week’s 254,000, revised down from 261,000. Continuing Claims for the week ended July 23 increased 48,000 to 1,416,000, above expectations of 1,385,000.
The Week Ahead
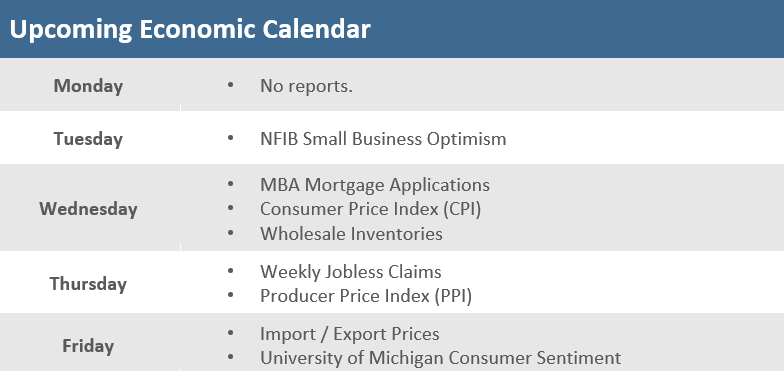
The economic calendar is light in the upcoming week, but the reports on the schedule will be closely followed. All eyes will be on the July inflation reports after last week’s tremendous jobs report. Consumer inflation (CPI) is due on Wednesday, producer inflation (PPI) on Thursday, and import prices on Friday. NFIB small business optimism and University of Michigan consumer sentiment will provide some insight into whether businesses and their consumers are feeling better as inflation pressures have waned in recent weeks. The earnings calendar will also be light as the second quarter earnings season winds down with 431 of the S&P 500 companies already reported.
Did You Know?
THE OTHER 4TH OF JULY – Every July 4th Americans celebrate the nation’s independence. But this July investors got an extra July 4th to celebrate… July 2022 was the 4th best July ever for U.S. stock returns. The S&P 500 was up +9.2% in July 2022. Historically, July had a +2.0% return on average since 1926. The top 10 Julys have averaged +11.7%. What happens the rest of the year after a strong July? After the other top 9 Julys, the remaining 5 months of the year (Aug-Dec) averaged a +6.7% return (source: BlackRock, Morningstar).
STOCKS AND RATE HIKES – Between 2/04/1994 and 2/01/1995, the Fed raised interest rates 7 times. 4 of the 7 rate hikes were at least 0.50 percentage points, a total increase of 3 percentage points for all 7 rate hikes. That took the Fed’s target short-term rate from 3.0% to 6.0%. From the close of trading on 2/04/1994 to the close of trading on 2/01/1995, the S&P 500 gained +3.0% (total return) over the 1-year. The Fed raised short-term rates by 0.75 percentage points on Wednesday 7/27/2022, its 4th rate hike since 3/16/2022, making it a total of 2.25 percentage point increases this year (source: Federal Reserve, BTN Research).
IT’S AN IMPROVEMENT – The budget deficit of the US government after 9 months of the fiscal year 2022, i.e., the 9 months from 10/01/2021 through 6/30/2022, is $515 billion. Over the same 9 months during the fiscal year 2021, the budget deficit was $2.24 trillion, while over the same 9 months during the fiscal year 2020, the budget deficit was $864 billion (source: Treasury Department, BTN Research).
This Week in History
DOWNGRADE – On August 5, 2011, the credit rating agency Standard & Poor’s downgraded the credit rating of the United States, stripping the world’s largest economy of its prized AAA status, which it had held for 70 years. The yield on the 10-year T-note was 2.57% on 8/5/2011. The yield on the 10-year T-note closed at 2.83% on Friday 8/5/2022 (source: Treasury Department, Bloomberg, BTN Research).
Asset Class Performance
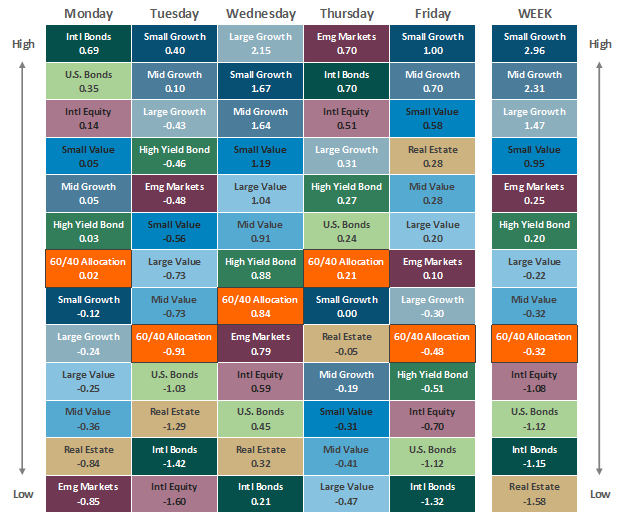
The Importance of Diversification. Diversification mitigates the risk of relying on any single investment and offers a host of long-term benefits, such as lowering portfolio volatility, improving risk-adjusted returns, and helping investments to compound more effectively.
Source: Bloomberg. Asset‐class performance is presented by using market returns from an exchange‐traded fund (ETF) proxy that best represents its respective broad asset class. Returns shown are net of fund fees for and do not necessarily represent the performance of specific mutual funds and/or exchange-traded funds recommended by The Retirement Planning Group. The performance of those funds may be substantially different than the performance of the broad asset classes and to proxy ETFs represented here. U.S. Bonds (iShares Core U.S. Aggregate Bond ETF); High‐Yield Bond (iShares iBoxx $ High Yield Corporate Bond ETF); Intl Bonds (SPDR® Bloomberg Barclays International Corporate Bond ETF); Large Growth (iShares Russell 1000 Growth ETF); Large Value (iShares Russell 1000 Value ETF); Mid Growth (iShares Russell Mid-Cap Growth ETF); Mid Value (iShares Russell Mid-Cap Value ETF); Small Growth (iShares Russell 2000 Growth ETF); Small Value (iShares Russell 2000 Value ETF); Intl Equity (iShares MSCI EAFE ETF); Emg Markets (iShares MSCI Emerging Markets ETF); and Real Estate (iShares U.S. Real Estate ETF). The return displayed as “Allocation” is a weighted average of the ETF proxies shown as represented by: 30% U.S. Bonds, 5% International Bonds, 5% High Yield Bonds, 10% Large Growth, 10% Large Value, 4% Mid Growth, 4% Mid Value, 2% Small Growth, 2% Small Value, 18% International Stock, 7% Emerging Markets, 3% Real Estate.
Chris Bouffard is CIO of The Retirement Planning Group (TRPG), a Registered Investment Adviser. He has oversight of investments for the advisory services offered through TRPG.
Disclaimer: Information provided is for educational purposes only and does not constitute investment, legal or tax advice. All examples are hypothetical and for illustrative purposes only. Past performance of any market results is no assurance of future performance. The information contained herein has been obtained from sources deemed reliable but is not guaranteed. Please contact TRPG for more complete information based on your personal circumstances and to obtain personal individual investment advice.


