Quick Takes
- The consumer price index was flat from June to July, and the annual rate came in lower than expected, primarily from falling energy prices. In addition, the producer price index and import prices fell more than expected, suggesting that peak inflation may be behind us.
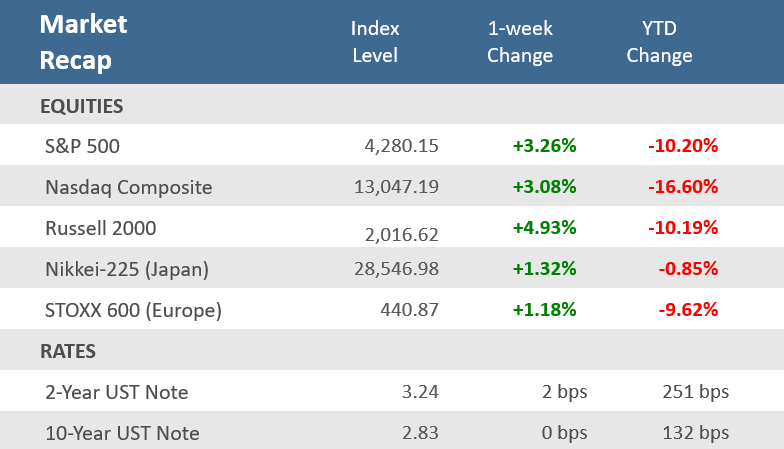
- Major U.S. stock indices gained for the fourth week in a row, with the S&P 500, Nasdaq Composite, and Russell 2000 up +3.3%, +3.1%, and +4.9% respectively. It was the longest winning streak for all three indices since November 2021. They’re now all up in six of the last eight weeks.
- Treasuries weren’t as convinced as stocks about the economic outlook. The spread between the 2-year and 10-year Treasury yields inverted further to -41 basis points. The 2-year Treasury yield, which is sensitive to changes in the fed funds rate, ended the week up two basis points at 3.24%, while the 10-year yield settled unchanged at 2.83%.
Inflation recedes, stocks extend winning streak to 4 weeks
Is the bull back? Stocks are celebrating after several key reports indicated that inflation may finally be cooling, and consumer sentiment may be rising. Major U.S. stock indices gained for the fourth week in a row, with the S&P 500, Nasdaq Composite, and Russell 2000 up +3.3%, +3.1%, and +4.9% respectively. It was the longest winning streak for all three indices since November 2021. Positive inflation data buoyed stocks. The consumer price index was flat from June to July, primarily from falling energy prices, and the producer price index and import prices also fell more than expected. Friday’s better-than-expected consumer sentiment report also gave a boost to investors. The week’s gains have extended a market rally off the June 16th lows. The S&P 500 has increased +16.7% since the low, retracing about 50% of its losses from the January 3rd peak. The Nasdaq has rebounded +22.6% from its low, enough to push the tech-heavy index into a new bull market, defined as a gain of +20% from a recent low. The positive economic reports, and corresponding market rally, have led some to believe that the recent gains are more than just a bear market rally.
On the other hand, bond investors continue to take a more pessimistic view. In particular, the Treasury market doesn’t seem as confident as the stock market, with the spread between the 2-year and 10-year Treasury yields inverting further to -41 basis points. The 2-year Treasury yield, which is sensitive to changes in the fed funds rate, ended the week up two basis points at 3.24%, while the 10-year yield settled unchanged at 2.83%. For bond investors, the more moderate inflation is a welcome development, but it is still unacceptably high. The Fed’s inflation target is 2.0%, much lower than the better-than-expected 8.5% annual CPI rate and the 9.8% annual PPI rate. To be sure, inflation appears to be moving in the right direction, but there is a lot more room for improvement before the Federal Reserve will be comfortable that inflation is back under control. In addition, the Fed’s balance-sheet reduction program will start to ramp up in the second half of the year, which may add upward pressure to bond yields.
Chart of the Week
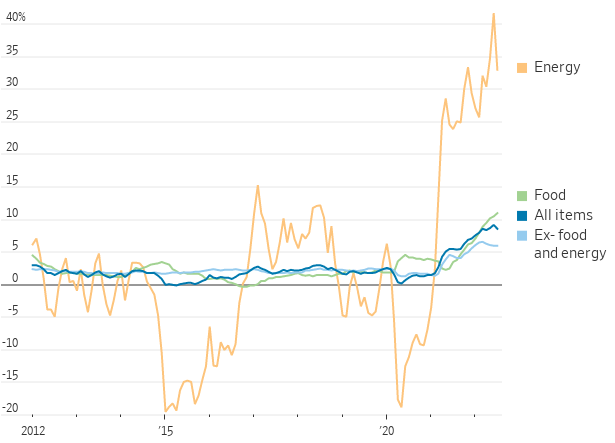
The pace of consumer price increases slowed in July as energy costs dropped, pulling annual U.S. inflation down slightly from a four-decade high. On Wednesday the Labor Department reported that the Consumer Price Index (CPI), a measure of what consumers pay for goods and services, rose +8.5% in July from the same month a year ago, down from June’s unrevised +9.1% annual rate, which was the fastest pace of inflation since November 1981. On a monthly basis, the CPI was flat in July after rising for 25 consecutive months. Expectations for the month of July were for an increase of +0.2% following June’s unrevised +1.3% increase. Core CPI, which strips out food and energy, increased +0.3% for the month, below expectations for +0.5% rise and below June’s unadjusted +0.7% increase. Core CPI was up +5.9% from last July, below expectations of +6.1%, and matching June’s unrevised rise. The Bureau of Labor Statistics (BLS) said a drop in gasoline and natural gas prices offset food and shelter costs increases. Additionally, prices for airline fares, used vehicles, communication, and apparel declined. Still, medical care, motor vehicle insurance, household furnishings, new vehicles, and recreation costs increased, primarily because of falling energy prices such as gasoline.
Lower, but Not Low
U.S. Consumer Price Index, 12-month change
Economic Review
- The July Producer Price Index (PPI) declined -0.5% for the month, well below expectations for a +0.2% rise and June’s downwardly revised +1.0% rise. Core PPI rose +0.2% for the month, below expectations to match the prior month’s unrevised +0.4% rise. Year-over-year headline PPI was +9.8% higher, below expectations of +10.4%, and the prior month’s unadjusted +11.3% rise. Core PPI was up +7.6% from last July, below expectations of +7.7%, and well below June’s upwardly revised +8.4% rise.
- The July Import Price Index fell -1.4% for the month, more than the expected drop of -1.0%, and far below June’s revised +0.3% gain. Year-over-year prices rose by +8.8%, below expectations of +9.4% and June’s unrevised +10.7% rise. Import prices excluding petroleum were down -0.7% for the month, below estimates for a -0.2% decline.
- The National Federation of Independent Business (NFIB) Small Business Optimism Index rose to 89.9 in July from 89.5 in June, where it was expected to remain. The index came off its lowest level since early 2013. The NFIB said, “The uncertainty in the small business sector is climbing again as owners continue to manage historic inflation, labor shortages, and supply chain disruptions…. As we move into the second half of 2022, owners will continue to manage their businesses into a very uncertain future.”
- The preliminary August University of Michigan Consumer Sentiment Index rose to 55.1 from July’s final reading of 51.5, exceeding expectations of 52.5. That is the second consecutive gain since the index hit 50 in June, which was the lowest reading on record dating back to 1952. The Expectations component of the index increased noticeably to more than offset a decline in the Current Conditions component. The 1-year inflation forecast fell to 5.0% from 5.2% in July, below expectations of 5.1%, but the 5-10-year inflation forecast unexpectedly rose to 3.0%, from 2.9%, above expectations of 2.8%.
- The weekly MBA Mortgage Application Index rose +0.2% following the prior week’s +1.2% rise, the second week of increases. The Refinance Index was up +3.5% from last week and the Purchase Index was up +1.0% for the week. The rebound came as the average 30-year mortgage rate fell 31 basis points to 5.34% but is still up +246bps from last year.
- Weekly Initial Jobless Claims were 262,000 for the week ended August 6, below expectations of 265,000, but higher than the prior week’s downwardly revised 248,000, revised down from 260,000. Continuing Claims for the week ended July 30 increased 8,000 to 1,428,000, above expectations of 1,420,000.
The Week Ahead
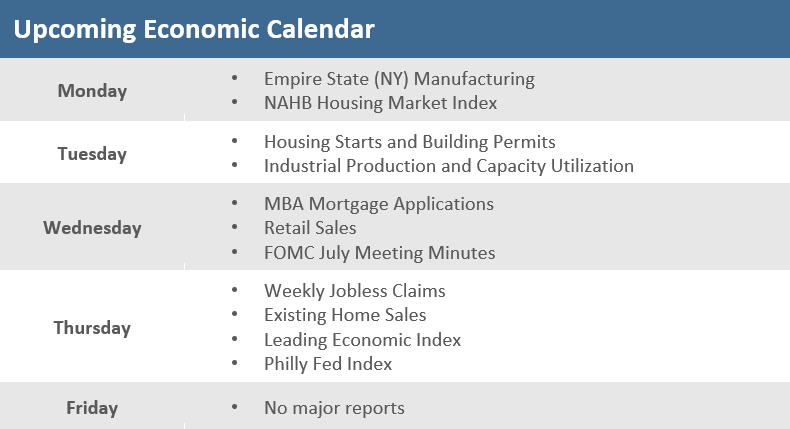
Next week, the economic calendar shifts from inflation reports to housing data, with reports on homebuilder sentiment, building permits and housing starts, and existing home sales. We will also get New York and Philadelphia regional manufacturing surveys for August. The July retail sales report and several prominent retailers’ earnings will be closely watched for clues on the strength of consumer spending. Walmart and Home Depot report earnings Tuesday and Target releases results Wednesday. The minutes from the Fed’s July monetary policy meeting will also be closely scrutinized and the Leading Economic Indicators (LEI) Index is also due.
Did You Know?
BIG COLA – Social Security recipients are on track to receive the highest cost-of-living increase in more than four decades next year. The annual increase applied to Social Security retirement benefits as of 1/01/2023 is based on “Consumer Price Index” inflation over the 12 months ending 9/30/2022. Inflation over the 9 months from 10/01/2021 through 6/30/2022 was 8.7%. The nonprofit Senior Citizens League estimates that if inflation remains at the current level, on average, over the next two months, the approximately 70 million retirees and disabled people who receive Social Security benefits could see their monthly checks rise by about 9.6% in 2023. The Social Security “cost-of-living” adjustment (COLA) has been at least +10% just twice in history: +14.3% in 1980 and +11.2% in 1981 (source: Department of Labor, BTN Research, The Wall Street Journal).
ROUGH SEAS – The cost of shipping a 40-foot container from China to the west coast of the United States has gone from $2,500 in June 2020 all the way up to $20,000 in September 2021 and has now receded back to a still-historically-elevated $9,500 in June 2022 (source: Freightos, BTN Research).
NO SMALL CONCERN – The share of U.S. small-business owners who said inflation was their No. 1 concern was 37%, according to a July survey by the National Federation of Independent Business (NFIB). That was the highest level since 1979. “The uncertainty in the small business sector is climbing again as owners continue to manage historic inflation, labor shortages and supply chain disruptions,” NFIB Chief Economist Bill Dunkelberg said (source: NFIB, The Wall Street Journal).
This Week in History
SCHEMING – On August 12, 1920, Charles Ponzi was arrested for financial fraud in Boston after taking in more than $6 million from thousands of investors. He repaid each $1,000 invested with $1,500 just 90 days later—but only by taking more money from newcomers or, as a judge later put it, “robbing Peter to pay Paul.” Such pyramid arrangements were forever afterward known as “Ponzi schemes” (source: The Wall Street Journal).
Asset Class Performance
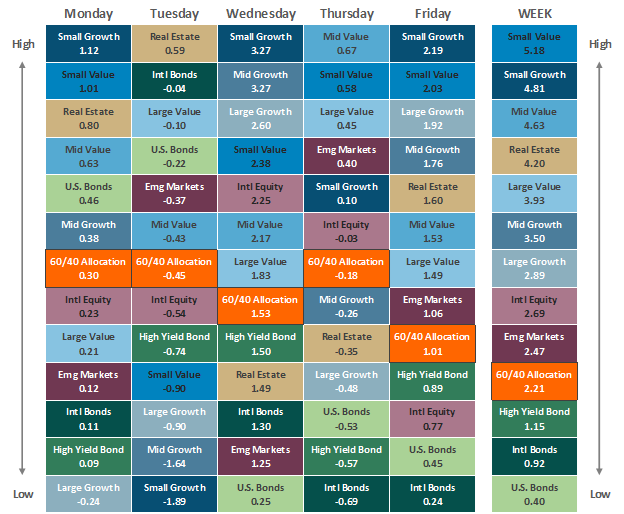
The Importance of Diversification. Diversification mitigates the risk of relying on any single investment and offers a host of long-term benefits, such as lowering portfolio volatility, improving risk-adjusted returns, and helping investments to compound more effectively.
Source: Bloomberg. Asset‐class performance is presented by using market returns from an exchange‐traded fund (ETF) proxy that best represents its respective broad asset class. Returns shown are net of fund fees for and do not necessarily represent the performance of specific mutual funds and/or exchange-traded funds recommended by The Retirement Planning Group. The performance of those funds may be substantially different than the performance of the broad asset classes and to proxy ETFs represented here. U.S. Bonds (iShares Core U.S. Aggregate Bond ETF); High‐Yield Bond (iShares iBoxx $ High Yield Corporate Bond ETF); Intl Bonds (SPDR® Bloomberg Barclays International Corporate Bond ETF); Large Growth (iShares Russell 1000 Growth ETF); Large Value (iShares Russell 1000 Value ETF); Mid Growth (iShares Russell Mid-Cap Growth ETF); Mid Value (iShares Russell Mid-Cap Value ETF); Small Growth (iShares Russell 2000 Growth ETF); Small Value (iShares Russell 2000 Value ETF); Intl Equity (iShares MSCI EAFE ETF); Emg Markets (iShares MSCI Emerging Markets ETF); and Real Estate (iShares U.S. Real Estate ETF). The return displayed as “Allocation” is a weighted average of the ETF proxies shown as represented by: 30% U.S. Bonds, 5% International Bonds, 5% High Yield Bonds, 10% Large Growth, 10% Large Value, 4% Mid Growth, 4% Mid Value, 2% Small Growth, 2% Small Value, 18% International Stock, 7% Emerging Markets, 3% Real Estate.
Chris Bouffard is CIO of The Retirement Planning Group (TRPG), a Registered Investment Adviser. He has oversight of investments for the advisory services offered through TRPG.
Disclaimer: Information provided is for educational purposes only and does not constitute investment, legal or tax advice. All examples are hypothetical and for illustrative purposes only. Past performance of any market results is no assurance of future performance. The information contained herein has been obtained from sources deemed reliable but is not guaranteed. Please contact TRPG for more complete information based on your personal circumstances and to obtain personal individual investment advice.


