Market Performance Summary
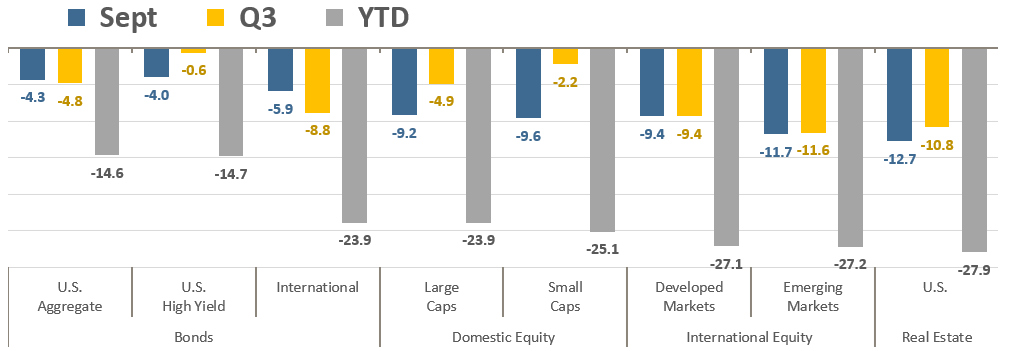
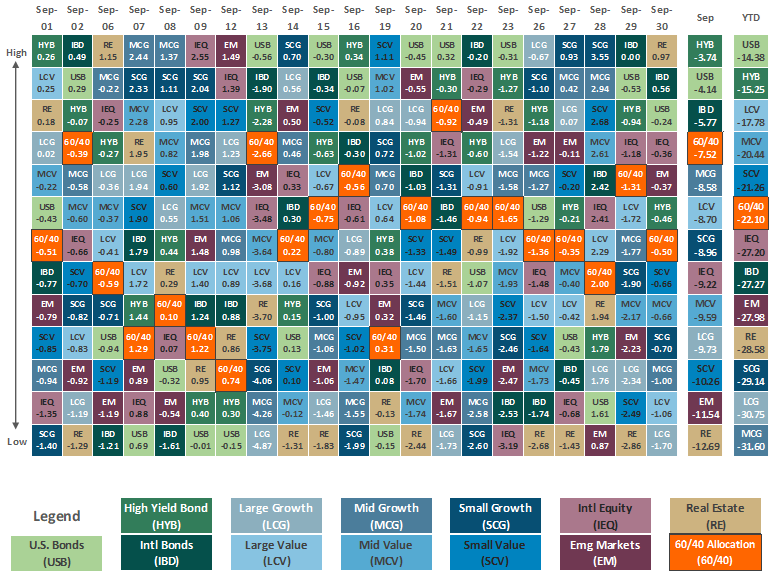
Markets continued their search for a bottom in September as volatility roiled equity and fixed-income markets from persistently high inflation and increasingly hawkish rhetoric from the Fed and other global central banks. All major asset classes finished the month lower and capped off another quarter of losses. It was the third quarter of losses for most asset classes, which has dragged them all into negative double-digit loss territory for 2022.
Asset Class Total Returns
Source: Bloomberg, as of September 30, 2022. Performance figures are index total returns: U.S. Bonds (Barclays U.S. Aggregate Bond TR), U.S. High Yield (Barclays U.S. HY 2% Issuer-Capped TR), International Bonds (Barclays Global Aggregate ex USD TR), Large Caps (S&P 500 TR), Small Caps (Russell 2000 TR), Developed Markets (MSCI EAFE NR USD), Emerging Markets (MSCI EM NR USD), Real Estate (FTSE NAREIT All Equity REITS TR).
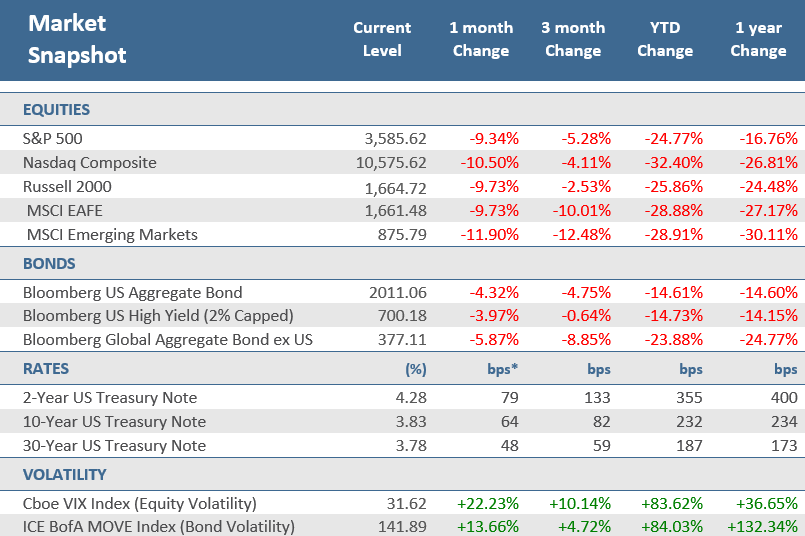
September is historically the most challenging month for U.S. equity returns and 2022 was certainly no exception. Throw into the mix a Federal Reserve that made its message to investors clear—that the central bank has no intention to pivot to a less aggressive policy stance anytime soon—and investors quickly, and rather decisively, sold risk assets. This was very apparent on the day of the Fed announcement of their third consecutive 75 basis point interest rate hike, in addition to raising their forecast for rates in both 2022 and 2023. Higher volatility assets significantly underperformed while lower volatility assets with factors like higher dividend yields and larger caps outperformed. For the month, the S&P 500 Index declined -9.3%, which was the worst monthly return since it plunged -12.5% in March 2020 as the pandemic was just unfolding (though it also sank more than -8% in both April and June earlier this year). U.S. small-cap stocks were also hit hard in September, falling -9.7% which was its worst month since April when it sank -10.0% (it was down more than twice that much in March 2020). The technology-heavy Nasdaq Composite took the brunt of the selling, giving up -10.5% for the month and is now down -32.4% for the year.
Normally when there is so much turmoil in the equity markets, bonds are ballast for portfolios. Unfortunately, with the Fed’s aggressive monetary policy tightening this year, bonds have offered little stability. The Bloomberg Aggregate US Bond Index pulled back -4.3% in September, its deepest one-month drawdown since February 1980 when it sank -5.9%, not much worse than its all-time biggest monthly loss of -6.1% in October 1979. The key bond benchmark is now down in eight of the last ten months. For the year, the index is down -14.6%, which would be its worst calendar year since data began for the index in 1977. Its prior maximum annual drawdown was -2.9% in 1994. This would also be the first back-to-back annual loses in history for bonds, after falling -1.5% last year. Of course, the culprit continues to be interest rates, which jumped sharply, particularly those with shorter maturities. As a result, much of the yield curve remains inverted, meaning shorter-term rates are mostly higher than longer-term rates. The benchmark 10-year U.S. Treasury note yield hit 4% for the first time in more than a decade in the final week of the month but backed off those levels before closing September at 3.8%. Still, that is up from 3.2% at the end of August but remains lower than the 1-year, 2-year, and 5-year Treasury yields. The 2-year yield jumped 79 basis points in September to 4.3% —its highest level since 2007, and its second-biggest monthly increase in the last 20 years.
Overseas, things were even worse for stocks and bonds which continue to underperform as the U.S. dollar. continues its unrelenting ascent. Developed international markets, measured by the MSCI EAFE Index, fell -9.7%, a bit further than their U.S. counterparts. Emerging market equities fared much worse, dropping -11.9%, led down by China which plunged -14.7%. The Chinese economy has struggled with several headwinds, such as the country’s zero Covid policy, weather-related disruptions, and lingering weakness in the housing market. But it wasn’t just China, most other Asian markets were challenged as evidenced by the MSCI Asia ex Japan Index dropping -12.7% in September. Close trade ties with China and/or heavy exposure to the technology sector, which has been battered by interest-rate hikes around the world, were the primary causes for the downside. For most TRPG clients, we are underweight non-U.S. stocks, at about 20% of equity allocations, as compared to purely passive portfolios that would have about 40% of their equity allocation in non-U.S. stocks (as measured by the MSCI All Country World Index). We also removed China from our emerging markets allocations in the first quarter.
Foreign bonds are also suffering their worst period historically. The Bloomberg Global Aggregate Bond ex U.S. Index fell -5.9% in September, its largest monthly decline since April when it lost -6.8%. The international bond index has now fallen in 12 of the last 14 months. As detailed further below (see “Follow the Leader”), central banks around the world have moved beyond talking tough about policy rates and have joined the Fed with actual rate hikes, many by amounts higher than expected by markets. For most TRPG client accounts, we removed non-U.S. bonds from portfolios in the first quarter and avoided the bulk of the drawdown this year.
On the economic growth front, data published over the third quarter showed a global growth slowdown. The J.P. Morgan Global Composite Purchasing Managers’ Index (PMI) fell to economic contraction levels in August for the first time since June 2020. Regional components such as Europe and the United Kingdom, they are on the verge of recession levels. European markets continue to be challenged by higher energy costs and a negative reaction to the U.K.’s recent fiscal and monetary policy.
Source: Bloomberg, as of September 30, 2022.
Price Returns for Equity, Total Returns for Bonds.
* The term basis points (bps) refers to a common unit of measure for interest rates and other percentages in finance. One basis point is equal to 0.01%. Bond prices and bond yields are inversely related. As the price of a bond goes up, the yield decreases.
Quick Takes
Can You Hear Me Now?
September was the month that Federal Reserve policymakers finally got their message through to investors as they ramped up their battle against the fastest inflation in 40 years. At the September Federal Open Market Committee (FOMC) meeting, Fed officials implemented a third straight supersized rate hike of 75 basis points, and in the post-meeting comments, they clearly articulated an aggressive path for monetary policy that would lift interest rates higher and keep them elevated longer than markets were pricing in. The FOMC estimated that rates will reach 4.6% by the end of 2023, well above their estimate of 3.8% in June, their last published estimate. Fed officials anticipate that they will pivot to lowering rates in 2024 but only at a slow pace. Ultimately, the likelihood that the Federal Reserve will keep tightening at its next two meetings this year remains the biggest headwind for global markets.
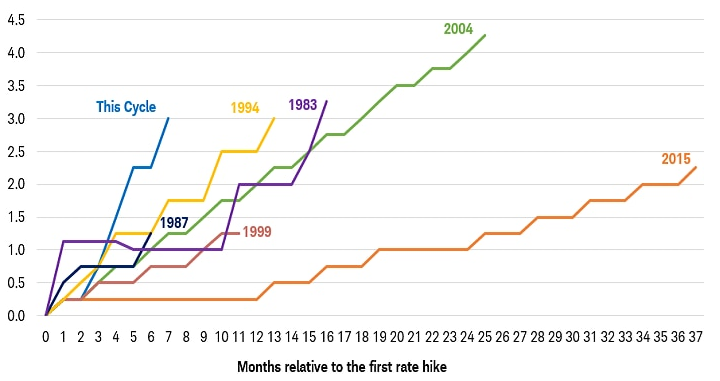
This is the Fastest Rate Hiking Cycle since the Early 1980s
Change in Fed Funds Rate (%)
Note: Lines represent the cumulative change in the Fed funds target rate from the start of each rate hike cycle shown.
For the current cycle, the Fed funds target rate has risen 3%, from 0.25% to 3.25%.
Federal Funds Target Rate – Upper Bound (FDTR Index), using monthly data.
Source: Bloomberg, Charles Schwab.
Follow the Leader.
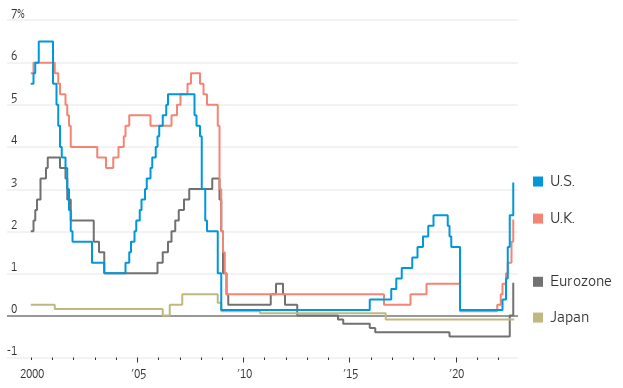
On Tuesday, September 20, Sweden’s Riksbank, the Swedish central bank, raised its policy rate by a supersized 100 basis points (i.e., a full percentage point, to 1.75%), its biggest increase in decades. Then on September 22, what was dubbed “Super Thursday”, several other world central banks raised rates, many by amounts larger than expected. The Bank of England raised its key interest rate for the seventh consecutive time, by 50 basis points to 2.25%, and announced that they will start selling some of their bond holdings. Norway increased rates by 50 basis points to 2.25%. Indonesia and the Philippines both raised their benchmark rates by 50 basis points to 4.25%. Taiwan hiked its discount rate up by 12.5 basis points to 1.625%. South Africa raised its rate 75 basis points to 6.25%. Also noteworthy from “Super Thursday”, the Swiss National Bank raised its key policy rate to 50 basis points from -0.25%., marking an end to Europe’s last remaining negative-rates experiment. The Swiss National Bank’s benchmark lending rate was below 0% since 2014. There was one notable world central bank that didn’t hike rates at their September meetings; the Bank of Japan left its policy rate unchanged at its previous low level, though they did take some policy action—announcing it intervened in currency markets to sell dollars and buy yen, the first such intervention in 24 years, an effort to slow the recent fall in the Japanese currency. Also, Turkey cut its rate a full percentage point to 12% from 13%, despite inflation surpassing 80% in August and prompting a renewed slide in the value of its currency.
World’s Central Banks Race to Raise Rates Following Fed Hikes
Major World Central Bank Interest Rates
Note: Data reflects the rates at the end of the month.
Source: Bank for International Settlements, The Wall Street Journal.
Stocks and Bonds Backpedal.
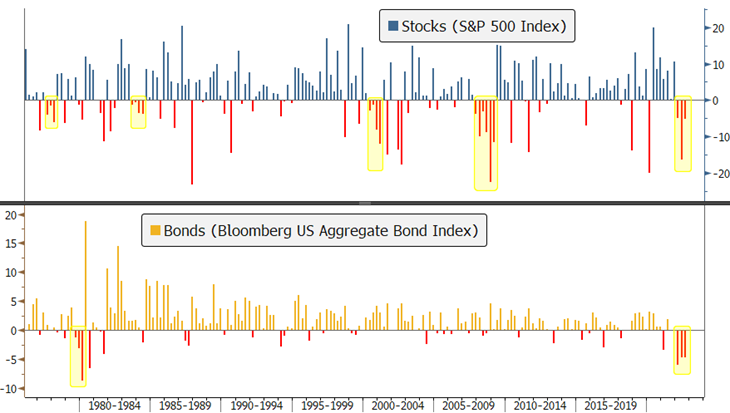
2022 is on pace to go down as the worst year for stocks and bonds since 2008. For the third quarter, the S&P 500 fell -5.3%, the Nasdaq slid -4.1%, and the Russell dipped -2.5. According to Bespoke Investment Group, this was the first time in about 80 years that the S&P 500 posted a quarterly loss after being up more than 10% at one point during those three months. All three major U.S. stock indices have now declined for three consecutive quarters, the longest stretch since the Global Financial Crisis. As seen in the top panel of the chart below, there have been a total of five instances in the last 47 years that have seen stocks, measured by the S&P 500 Index, endure three or more straight quarterly declines – so an event that occurs about once a decade. But what is so unusual about this year is that like stocks, bonds are also down for the third consecutive quarter. The Bloomberg U.S. Aggregate Bond Index was down -4.8% for the third quarter, slightly worse than the -4.7% loss in Q2, though better than the -5.9% loss in Q1, which was the largest quarterly loss since the index dropped -6.6% in Q3-1980. But unlike stocks, and as seen in the bottom panel of the chart below, the benchmark Bloomberg U.S. Aggregate Bond Index has only undergone one other period of three straight negative quarters over the last 47 years, in 1977/8. This is the first time that both stocks and bonds have suffered a three-quarter drawdown simultaneously. That’s a clear and direct result of virtually all major global central banks hiking their policy rates while their respective economies are experiencing decelerating growth.
Worst Year for Stocks and Bonds Since 2008
Quarterly returns (%) for stocks and bonds (1976 – 2022)
Note: Highlighted areas denote three or more consecutive negative quarters.
Source: Bloomberg, The Retirement Planning Group.
A Tale of Two Quarters.
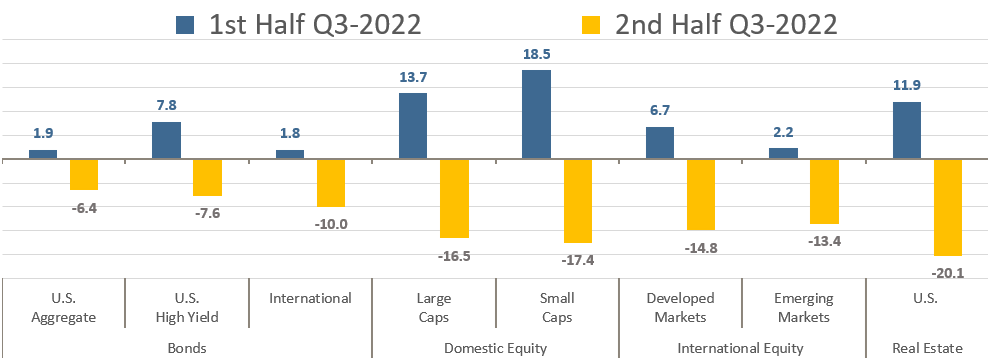
Last month we showed how August was a tale of two months, with gains in the first half of the month and losses in the second half of the month. And with August being the fulcrum month in the third quarter, it was very much the same dynamic for the full quarter. Investors were enthusiastically projecting a Fed pivot to softer, less aggressive monetary policy during the summer, but that took an abrupt turn in mid-August as the Fed, and central banks across the globe, vowed to step up their efforts to fight inflation. As investors watched central bank after central bank across the globe move from talking about hiking rates, to implementing rate hikes their appetites for risk assets quickly disappeared. As seen in blue bars on the chart below, at mid-quarter all major asset classes were sitting on decent gains. However, that all reversed right in the middle of August and the second half of the quarter brought losses across the board that wiped out the gains.
Third Quarter 2022 Total Returns
Capital Markets Sink in the Back Half of Q3 – 2022
Source: Bloomberg. First half, July 1 – Aug 15; second half, Aug 16-Sept 30.
Duration Duldrums.
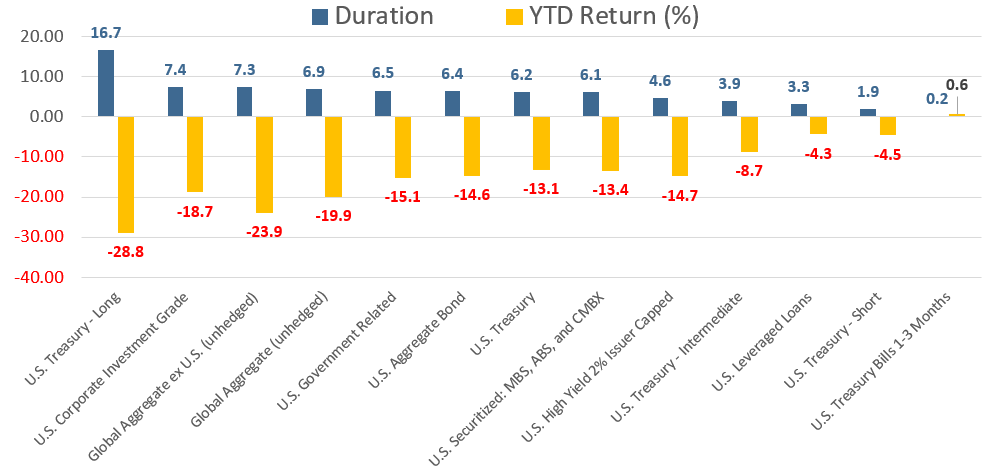
Bond duration is a way of measuring how much bond prices are likely to change in relation to changes in interest rates, so it is essentially a measurement of interest rate risk. A key characteristic of bonds is that rates and prices move in opposite directions. When interest rates rise, prices of traditional bonds fall, and vice versa. Duration is measured in years and typically the higher the duration, the more its price will drop as interest rates rise. That relationship can clearly be seen in the chart below. The bond sectors with the longest durations have suffered the biggest losses in 2022 as the Fed has transitioned to an aggressive rate hiking policy that has sent rates higher. For most TRPG clients, our portfolios are underweight duration, after moving approximately 20% of our bond allocations in the first quarter to strategies that have virtually no duration.
Duration Has Dragged Bond Portfolios in 2022
Various Bond Sector Durations and 2022 Performance
Source: Bloomberg. Data as of September 30, 2022.
Pulling the Tech Ripcord.
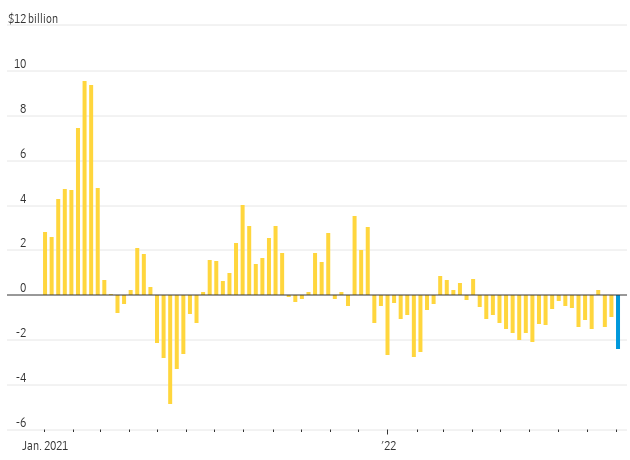
Duration has traditionally been a metric for the world of bonds, but it’s a concept that can be applied to equities as well. Equity duration can be thought of as the sensitivity of a stock’s cash flows to the level of interest rates. The further out in time a stock is expected to have positive cash flows, the higher its equity duration would be and the more sensitive it is likely to be to rising interest rates. In general, traditional value stocks and dividend-paying stocks are considered low duration because they are already cash flow positive and less exposed to changes in interest rates while growth stocks are considered long duration because their cash flows are expected to grow in the future. Technology stocks are one of the longest-duration sectors of the equity market and have been more susceptible to rapidly rising rates because the higher yields make their future cash flows less valuable in today’s dollars. As a result, investors are bailing out of technology-focused mutual and exchange-traded funds at a fast rate. As seen in the chart below, the tech selloff has been consistently negative since late fall and was intensifying in September, according to data from Refinitiv Lipper. Investors yanked about $2.4 billion from tech-focused funds in the three weeks that ended September 7. Most TRPG clients enjoyed the benefit of a dedicated technology overlay in their portfolios from the summer of 2020 through the first quarter of this year. However, in anticipation of the rising rate headwinds, decelerating growth, and historically high valuations, in the first quarter, we completely removed the dedicated technology strategy from our portfolios.
Bailing Out of Technology-Focused Mutual and Exchange-Traded Funds
Rolling three-week fund flows
Source: Refinitiv Lipper, The Wall Street Journal.
Looking Ahead.
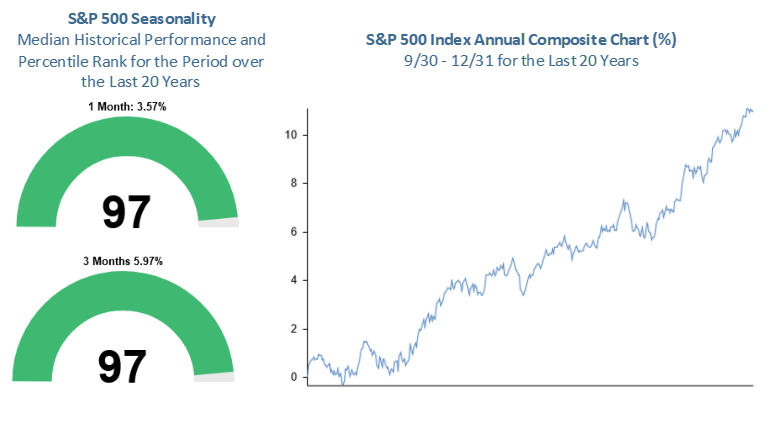
These are very challenging times that can test investors’ ability to stick to their long-term investment strategies and financial plans. However, the short-term market turmoil doesn’t negate the long-term benefits that a well-diversified, risk-appropriate portfolio has historically delivered. As discussed throughout this month’s update, the first three quarters of the year have been one of the worst in decades. The good news is that we made it to the fourth quarter, which has historically been the strongest of the year – particularly in mid-term election years. Over the last 20 years, the S&P 500 in the month of October has a median return of +3.6% and the fourth quarter has a median return of +6.0%. Both of those returns are in the 97 percentile for their respective periods over the last 20 years – in other words, there essentially hasn’t been a stronger 1-month or 3-month period over the last 20 years. The fourth quarter Composite Chart for the 20 years on the right shows the average annual gain over the fourth quarter has averaged over +10%.
Seasonally, the Fourth Quarter is Favorable for Stocks
S&P 500 Index Monthly Returns (2002 – 2021)
Source: Bespoke Investment Group.
Will the seasonal strength of the equity markets kick in now? It’s impossible to know, but JP Morgan points out that S&P 500 forward multiples are currently about -9% below their long-term average, while high-quality fixed-income valuations are currently sitting at 10-year lows. These attractive valuations, coupled with elevated interest rates and equity volatility, should be welcomed by investors, as the combination of the two has historically led to significant long-term investment opportunities.
Asset Class Performance
The Importance of Diversification. Diversification mitigates the risk of relying on any single investment and offers a host of long-term benefits, such as lowering portfolio volatility, improving risk-adjusted returns, and helping investments to compound more effectively.
Source: Bloomberg.
Asset‐class performance is presented by using market returns from an exchange‐traded fund (ETF) proxy that best represents its respective broad asset class. Returns shown are net of fund fees for and do not necessarily represent performance of specific mutual funds and/or exchange-traded funds recommended by The Retirement Planning Group. The performance of those funds may be substantially different than the performance of the broad asset classes and to proxy ETFs represented here. U.S. Bonds (iShares Core U.S. Aggregate Bond ETF); High‐Yield Bond (iShares iBoxx $ High Yield Corporate Bond ETF); Intl Bonds (SPDR® Bloomberg Barclays International Corporate Bond ETF); Large Growth (iShares Russell 1000 Growth ETF); Large Value (iShares Russell 1000 Value ETF); Mid Growth (iShares Russell Mid-Cap Growth ETF); Mid Value (iShares Russell Mid-Cap Value ETF); Small Growth (iShares Russell 2000 Growth ETF); Small Value (iShares Russell 2000 Value ETF); Intl Equity (iShares MSCI EAFE ETF); Emg Markets (iShares MSCI Emerging Markets ETF); and Real Estate (iShares U.S. Real Estate ETF). The return displayed as “Allocation” is a weighted average of the ETF proxies shown as represented by: 30% U.S. Bonds, 5% International Bonds, 5% High Yield Bonds, 10% Large Growth, 10% Large Value, 4% Mid Growth, 4% Mid Value, 2% Small Growth, 2% Small Value, 18% International Stock, 7% Emerging Markets, 3% Real Estate.
* The term basis points (bps) refers to a common unit of measure for interest rates and other percentages in finance. One basis point is equal to 0.01%. Bond prices and bond yields are inversely related. As the price of a bond goes up, the yield decreases.
Chris Bouffard is CIO of The Retirement Planning Group (TRPG), a Registered Investment Adviser. He has oversight of investments for the advisory services offered through TRPG.
Disclaimer: Information provided is for educational purposes only and does not constitute investment, legal or tax advice. All examples are hypothetical and for illustrative purposes only. Past performance of any market results is no assurance of future performance. The information contained herein has been obtained from sources deemed reliable but is not guaranteed. Please contact TRPG for more complete information based on your personal circumstances and to obtain personal individual investment advice.

