Market Performance Summary
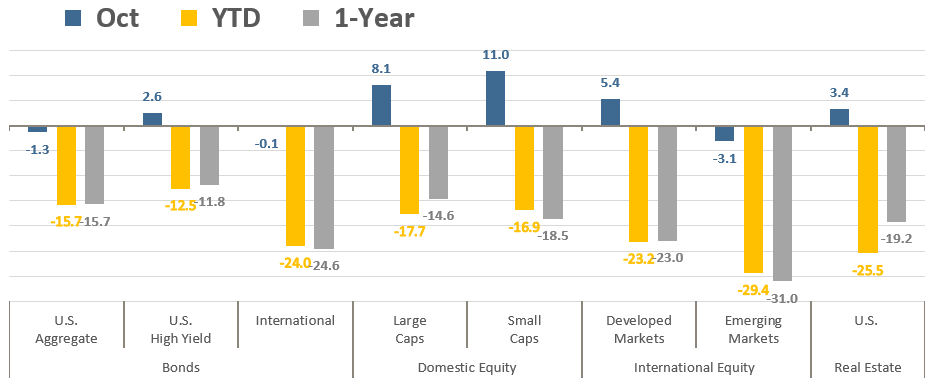
Global stocks surged in October, just a month after a September slide that left many stock indexes well into bear market territory. Stocks and bonds have moved in tandem for much of the year, however, for the most part, bonds did not join in the October fun, as yields continued to push higher, and bonds prices slide further for the year.
Asset Class Total Returns
Source: Bloomberg, as of October 31, 2022. Performance figures are index total returns: U.S. Bonds (Barclays U.S. Aggregate Bond TR), U.S. High Yield (Barclays U.S. HY 2% Issuer-Capped TR), International Bonds (Barclays Global Aggregate ex USD TR), Large Caps (S&P 500 TR), Small Caps (Russell 2000 TR), Developed Markets (MSCI EAFE NR USD), Emerging Markets (MSCI EM NR USD), Real Estate (FTSE NAREIT All Equity REITS TR).
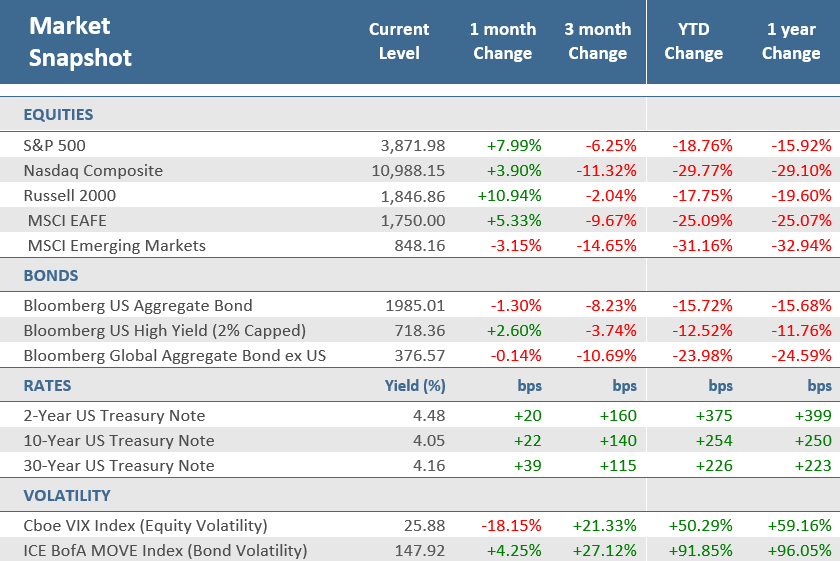
The S&P 500 rebounded +8.0% in October, its best month since July when it was up +9.1%. That was its best month since November 2020. A better-than-feared third-quarter earnings season, and hope that the Fed may slow its pace of rate hikes, helped the S&P rally +8.2% from its October 12th low, at which point it was -24.4% from its January 4th all-time high. The Russell 2000 small cap index was up double digits, popping +10.9% higher in October. The Nasdaq Composite, which is more heavily weighted in technology and growth stocks, was up +3.9% during the month. It trailed the other major U.S. indices because of the declines in “Big Tech” names like Alphabet (Google’s parent company), Amazon.com (AMZN), Microsoft (MSFT), and Tesla (TSLA) that all fell -7% or more after disappointing third-quarter earnings reports in the final week of the month. All three indexes snapped two-month losing streaks.
One of the big stories for the month that garnered a lot of headlines was the performance of the Dow Jones Industrials Average, which spiked +14.0 in October—its best month since January 1976. The Dow is the oldest U.S. stock index, with a history going back to the late 1800s. Despite its long history, it isn’t an ideal reference for the U.S. stock market because it is only made up of 30 stocks, and therefore isn’t as well diversified as the other, more modern, U.S. stock indices. The Dow is a price-weighted index, making it unusual among market benchmarks. Stocks with higher prices are weighted more heavily than stocks with smaller prices regardless of the size of the firm. Hypothetically, a company with a $500 per share stock price would be weighted five times more in the index than a company with a $100 per share stock price. Most major stock indexes are weighted by their market capitalization which is a function of the stock price multiplied by the number of shares – a representation of the company’s total market value, not just a function of the stock price per share like the price-weighted Dow.
For overseas stocks, October was a mixed month of performance. Developed markets equities, like their U.S. counterparts, saw a healthy rebound. The MSCI Europe, Asia, and Far East (EAFE) index was up +5.3%, its best month since November 2020. It also benefitted from better-than-expected earnings results which helped it overcome concerns about inflation and slowing growth that had been weighing on investors for much of 2022. Emerging markets stocks weren’t as fortunate though, dropping -3.1% for the month. It was their largest underperformance to developed market equities since July 2015. Emerging Markets have been flat or negative every month of 2022. China, which makes up about 40% of the index, was down -16.8% in October.
Over the bond market, yields trended higher for another month. The 10-year U.S. Treasury yield rose +22 basis points (+0.22 percentage points) in October, to 4.05%. That’s its third-straight month of gains, during which the yield has advanced 140 basis points, its largest three-month gain in yield since 1984. The 2-year Treasury yield rose +20 basis points to reach the highest level since August 2007 as the futures market priced in a new peak fed funds rate of about 5.0% by the spring of next year. With the rise in yields, the Bloomberg US Aggregate Bond Index fell -1.3%, its fourth decline in the last five months. Rising yields weren’t just happening in the U.S., they climbed across the globe as most major central banks continued aggressive monetary policy to fight inflation. International bonds were down -0.1%, their 14th decline in the past fifteen months. High-yield bonds were able to buck the trend and gained +2.6%, their first advance since July and only the third positive month this year.
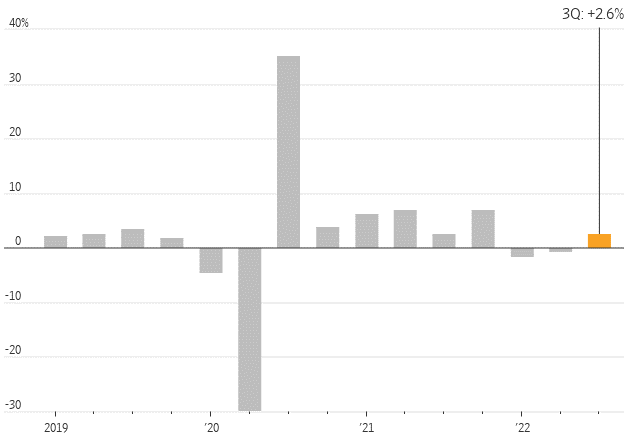
The U.S. economy looks like it will avoid a third consecutive negative quarter of growth as the preliminary release of Q3-2022 Gross Domestic Product (GDP), the broadest measure of U.S. economic output, showed an annualized gain of +2.6% for the third quarter due to a boost in net exports and personal consumption. However, ISM Manufacturing declined to its lowest level since May 2020 but remains at expansionary levels. The pace of headline inflation, as measured by the headline consumer price index (CPI) eased for the third consecutive month yet remains over +8% from last year’s level. On the other hand, Core CPI, which excludes food and energy prices, accelerated to the fastest pace since August 1982. That will keep pressure on the Fed to remain vigilant in its battle against inflation.
Source: Bloomberg, as of October 31, 2022.
Price Returns for Equity, Total Returns for Bonds.
* The term basis points (bps) refers to a common unit of measure for interest rates and other percentages in finance. One basis point is equal to 0.01%. Bond prices and bond yields are inversely related. As the price of a bond goes up, the yield decreases.
Quick Takes
NOT BAD BUT NOT ALL GOOD.
The U.S. economy grew at an inflation-adjusted annual rate of +2.6% in the third quarter, snapping two consecutive quarters of GDP declines. That’s good but despite the positive number the report showed plenty of evidence of a slowing economy, weighed down by high inflation, rising interest rates, and slowing consumer spending. Much of the increase came from a rise in exports – largely caused by the stronger dollar – and a decline in imports. Those factors likely won’t offer a similar boost in the future. Consumer spending also rose at a slower pace, as households pulled back on purchases of goods and services. The report may indicate that the Federal Reserve’s interest rate increases are starting to dampen economic activity. Residential investment was down to a 26.4% rate, reflecting a sharp deterioration in the housing market. Excluding the pandemic-driven downturn of 2020, it was the steepest drop since 2010. One bright spot remains the labor market, which continues to be resilient even though it has cooled off.
GDP Grows at Slightly Hotter-Than-Expected Pace in Q3
Real GDP, change from the previous quarter
Note: Note: Seasonally adjusted at annual rates.
Source: Commerce Department, The Wall Street Journal.
TRICK OR TREAT.
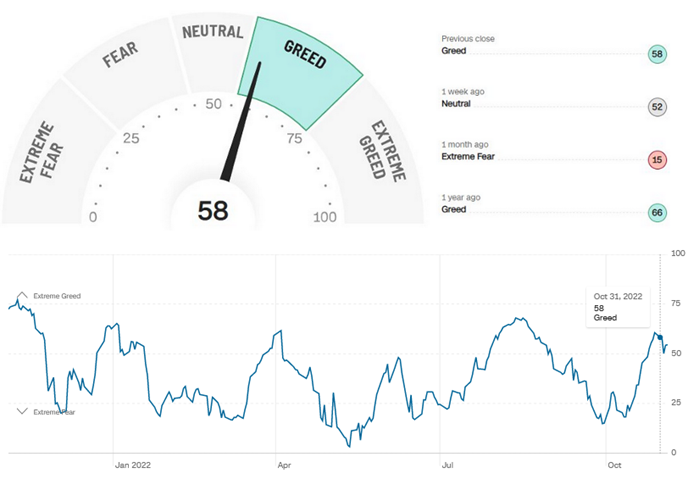
October is the month for the Halloween holiday, and like the markets all year, it delivered both tricks and treats. As mentioned above, the stock market dropped to its lowest level of the year on October 12th. Fortunately for investors, stocks concluded the month with a nice, broad +8.2% rally from there. There’s an old saying on Wall Street that nothing improves sentiment more than higher prices. That seems to be the case with the CNN Fear & Greed Index, an aggregate composition of seven different market indicators. The Fear & Greed started October at an “Extreme Fear” reading of just 15 (out of a total of 100) but ended October at its highest level since the height of the August recovery off the June lows. It closed October at 58 but was at 61 on the second to last trading day of the month, its highest level since reaching 64 on August 19th. The seven components track market momentum, stock price strength, stock price breadth, put and call options, junk bond demand, market volatility, and demand for safe havens.
Maybe the Market’s Changing its Mind?
CNN Fear & Greed Index hit its highest point since August
Source: CNN Business.
IS SEVEN REALLY A MAGIC NUMBER?
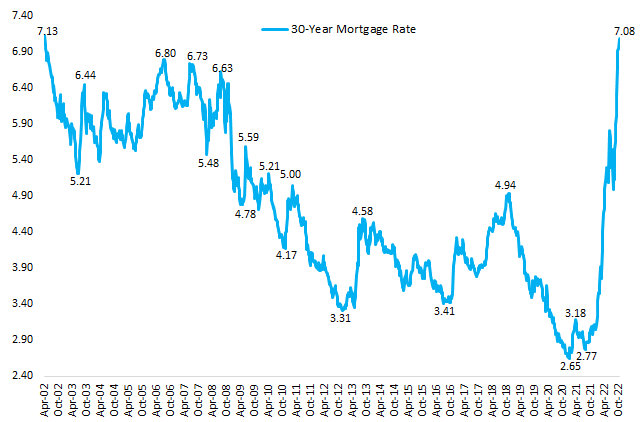
In cognitive science, Miller’s Law of the “Magic Number Seven” purports that the number of objects an average human can hold in working memory is 7, plus or minus 2 items. But for Americans looking to buy a home, seven is a number they’d likely want to forget altogether. At the end of October, in the wake of the Fed’s months-long rate hiking exercise, the 30-year mortgage rate in the U.S. moved above 7% for the first time since 2002. The sharp move higher, shown in the chart below, is anything but trivial. The impact on affordability is meaningful and has resulted in lower demand, higher inventories, tumbling transactions, and lower sales prices. Charlie Bilello of Compound Capital points out that two years ago the 30-year mortgage rate was 2.80% and the average new home price in the U.S. was $395,000. Today the 30-year mortgage rate is 7.08% and the average new home price is $518,000. As a result, assuming a 20% rate on the down payment, the down payment amount has increased by $25,000 and the monthly payment has increased 114% from $1,298 to $2,779.
Mortgage Rates Top 7%, the Highest Since 2002
30-Year Fixed Mortgage Rate (Freddie Mac)
Source: Compound Capital.
EARNINGS UPDATE.
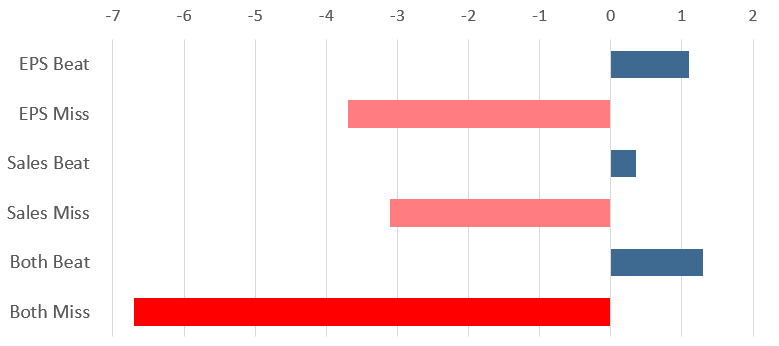
Investors have little patience for lackluster earnings results. With third-quarter results in from roughly half of S&P 500 companies so far, about 72% are beating Wall Street earnings expectations, according to FactSet. That’s behind the five-year average of a 77% beat rate. Companies missing earnings and revenue expectations are being punished sharply by investors. According to Bank of America analysis, shares of companies missing analysts’ estimates for both earnings and revenue are underperforming the overall market, measured by the S&P 500, by -6.7% the next trading day—the largest disparity in history. Even companies that are topping estimates aren’t beating them by much. Overall, companies are reporting earnings +2.2% above estimates, according to FactSet as of October 28. That’s well below the five-year average of +8.7%.
Q3-2022 Earnings Reactions: Misses Punished Harshly
The relative performance of reported companies versus S&P 500, 1-day post-results
Source: Bank of America, FactSet, The Wall Street Journal.
REACTION RESILIENCY.
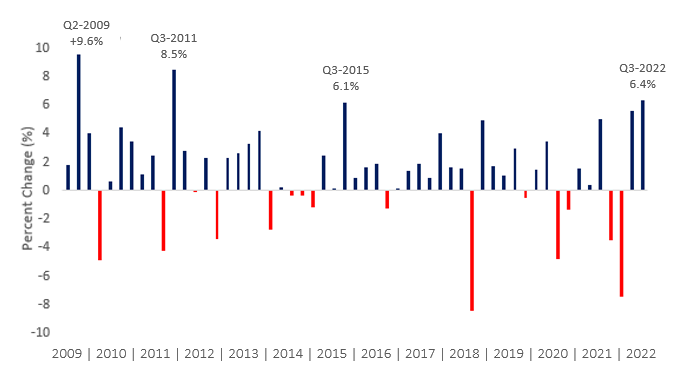
With earnings season barely half over, there’s been memorable results. Apple (AAPL) has really bucked the trend of the earnings misses mentioned above. It was able to rally over +7% in reaction to its earnings report in the last week of October, but the other mega-caps companies in the S&P 500 like Alphabet (Google’s parent company), Amazon.com (AMZN), Microsoft (MSFT), and Tesla (TSLA) all fell -7% or more in reaction to their reports and are largely responsible for that big red bar in the chart above. Additionally, Meta (Facebook’s parent company), has dropped from being a mega-cap stock because it has fallen so much, losing a quarter of its market capitalization in a single day! Yet even in the face of the punishment or the S&P 500’s largest stocks in response to disappointing earnings results, the overall index is still up over +6% this earnings season. That is impressive resilience. The chart below compares the performance of the S&P 500 at this point in the third quarter earnings season to the same point (24 calendar days) in each prior earnings season since the start of 2009. The +6.4% rally so far ranks as the best since Q3-2011. From the start of 2009, there have only been two other earnings seasons where the S&P 500 was up more at this point in the reporting period, and there were only five where it was up more than +5%. Of course, just because stock returns have done well this reporting period doesn’t mean they will persist; last earnings season the S&P 500 also performed well only to reverse from late August through early October. Still, the market’s ability to rally without the participation of its largest companies is notable.
S&P 500 Performance Earnings Season to Date*
The relative performance of reported companies versus S&P 500, 1-day post-results
*First 24 calendar days of earnings season from the Friday before large banks start reporting.
Source: Bespoke Investment Group.
MIDTERM MAGIC?
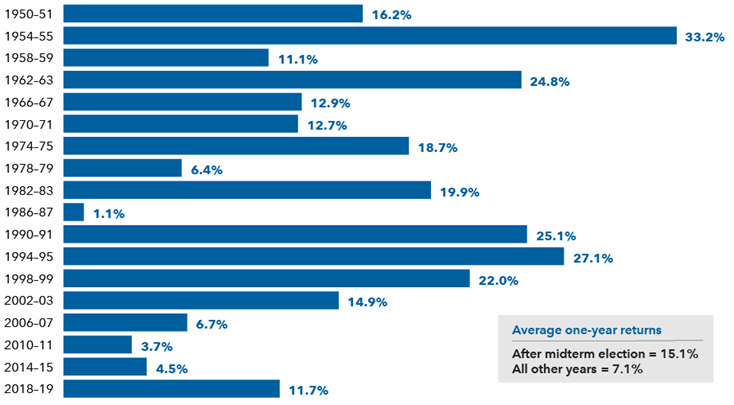
According to Dow Jones Market Data, the S&P 500 has moved higher in the one year following every midterm election since 1942. Stocks have typically rallied after the midterm elections because the results remove some uncertainty about what policies could come out of Washington. The post-midterm environment generally bodes well for stocks no matter which candidates win. On average, the index has gained about +15% in post-midterm years since World War II. Of course, past performance is no guarantee of future results, but if history is any guide, the probability of a positive year after this year’s midterm election is remarkably favorable.
U.S. Stocks Have a Spotless Record of Rising After Midterm Elections
S&P 500 Index price return one year after the midterm election
Sources: Capital Group, RIMES, Standard & Poor’s. Calculations use Election Day as the starting date in all election years and November 5th as a proxy for the starting date in other years. Only midterm election years are shown in the chart. As of 12/31/2021.
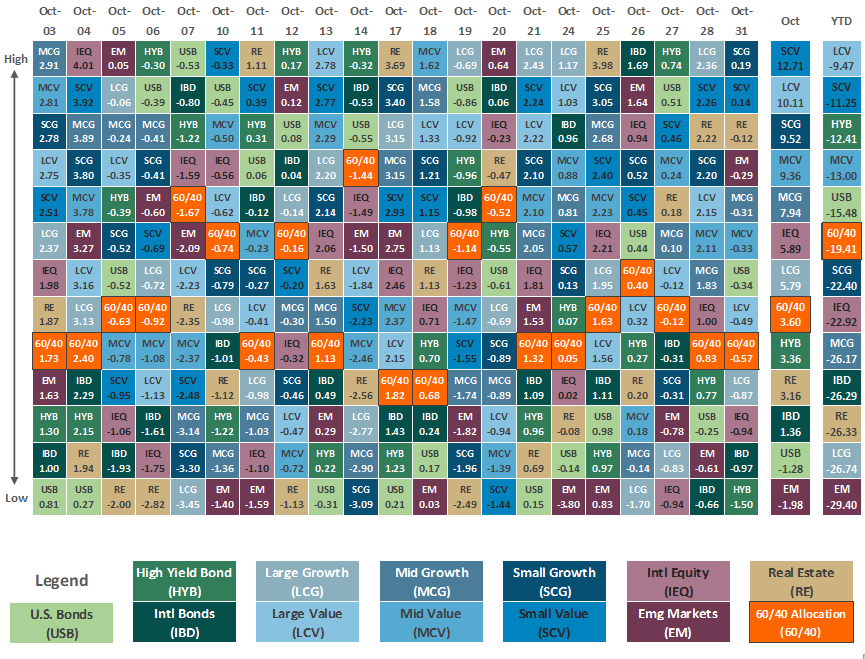
Asset Class Performance
The Importance of Diversification. Diversification mitigates the risk of relying on any single investment and offers a host of long-term benefits, such as lowering portfolio volatility, improving risk-adjusted returns, and helping investments to compound more effectively.
Source: Bloomberg.
Asset‐class performance is presented by using market returns from an exchange‐traded fund (ETF) proxy that best represents its respective broad asset class. Returns shown are net of fund fees for and do not necessarily represent performance of specific mutual funds and/or exchange-traded funds recommended by The Retirement Planning Group. The performance of those funds may be substantially different than the performance of the broad asset classes and to proxy ETFs represented here. U.S. Bonds (iShares Core U.S. Aggregate Bond ETF); High‐Yield Bond (iShares iBoxx $ High Yield Corporate Bond ETF); Intl Bonds (SPDR® Bloomberg Barclays International Corporate Bond ETF); Large Growth (iShares Russell 1000 Growth ETF); Large Value (iShares Russell 1000 Value ETF); Mid Growth (iShares Russell Mid-Cap Growth ETF); Mid Value (iShares Russell Mid-Cap Value ETF); Small Growth (iShares Russell 2000 Growth ETF); Small Value (iShares Russell 2000 Value ETF); Intl Equity (iShares MSCI EAFE ETF); Emg Markets (iShares MSCI Emerging Markets ETF); and Real Estate (iShares U.S. Real Estate ETF). The return displayed as “Allocation” is a weighted average of the ETF proxies shown as represented by: 30% U.S. Bonds, 5% International Bonds, 5% High Yield Bonds, 10% Large Growth, 10% Large Value, 4% Mid Growth, 4% Mid Value, 2% Small Growth, 2% Small Value, 18% International Stock, 7% Emerging Markets, 3% Real Estate.
* The term basis points (bps) refers to a common unit of measure for interest rates and other percentages in finance. One basis point is equal to 0.01%. Bond prices and bond yields are inversely related. As the price of a bond goes up, the yield decreases.
Chris Bouffard is CIO of The Retirement Planning Group (TRPG), a Registered Investment Adviser. He has oversight of investments for the advisory services offered through TRPG.
Disclaimer: Information provided is for educational purposes only and does not constitute investment, legal or tax advice. All examples are hypothetical and for illustrative purposes only. Past performance of any market results is no assurance of future performance. The information contained herein has been obtained from sources deemed reliable but is not guaranteed. Please contact TRPG for more complete information based on your personal circumstances and to obtain personal individual investment advice.

