October Performance Summary
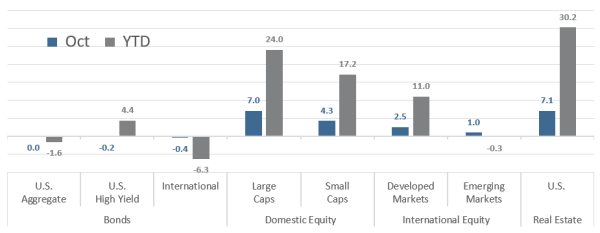
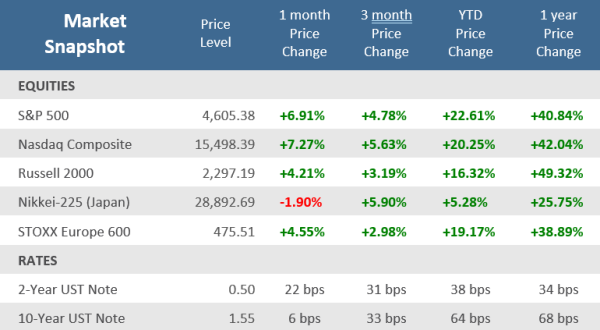
After wobbling a bit to start the month, October lived up to its reputation for strength. The S&P 500 Index began with four down days out of the first eight but was positive for all but two of the remaining days in October. The index finished the month at an all-time high, its 58th of the year, and produced a total return of +7.0% – its best month since November 2020 and more than offsetting September’s +4.7% decline. In fact, it was a robust month of gains for most stocks in the U.S. and globally. The S&P 500, Nasdaq Composite, and Dow Jones Industrial Average hit multiple record highs toward the end of the month, and all S&P sectors were positive. The tech-heavy Nasdaq Composite led U.S. indices with a +7.3% gain, while small-cap stocks lagged the market, but still with a +4.3% gain for the Russell 2000. Other than Brazil, India, and Japan, most country indices were positive as well. Developed markets outperformed emerging markets.
Source: Bloomberg, as of October 31, 2021. Performance figures are index total returns: U.S. Bonds (Barclays U.S. Aggregate Bond TR), U.S. High Yield (Barclays U.S. HY 2% Issuer-Capped TR), International Bonds (Barclays Global Aggregate ex USD TR), Large Caps (S&P 500 TR), Small Caps (Russell 2000 TR), Developed Markets (MSCI EAFE NR USD), Emerging Markets (MSCI EM NR USD), Real Estate (FTSE NAREIT All Equity REITS TR).
It was a different story for bonds. The yield on the 10-year U.S. Treasury hit a high of 1.7% during the month, its highest level since May, but much more significant gains in short-term rates resulted in a noticeable flattening of the yield curve. In the end, the 10-year yield gained six basis points while the 2-year Treasury yield was up 22 basis points and touched its highest level in 19 months. It was a similar story for yields overseas, and as a result, both U.S. and international bond indices finished October with declines (bond prices move inversely to yields).
Source: Bloomberg.
Quick Takes
Seasonality turns from a headwind to a tailwind
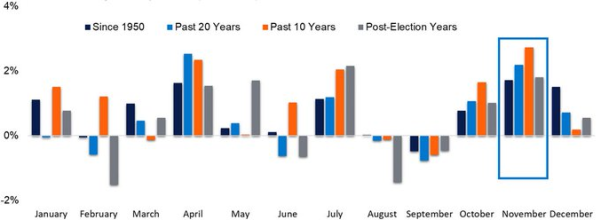
Last month we pointed how the seasonally weak months of August and September were behind us and that historically October, November, and December have been very favorable months for stocks. Well, October certainly didn’t disappoint on that front with the index advancing +6.9% for the month, well ahead of the average monthly gains. That has some wondering if some of the gains from November and December were pulled forward into October. Of course, we’ll have to wait and see if that plays out. November tends to start strong as companies are still reporting third-quarter earnings and consumer activity picks up as we head into the holiday season.
Historically November Has Been the Second-Best Month of the Year
S&P 500 Index Average Monthly Returns (1950-2020).
Source: FactSet, LPL Research.
Strength Begets Strength
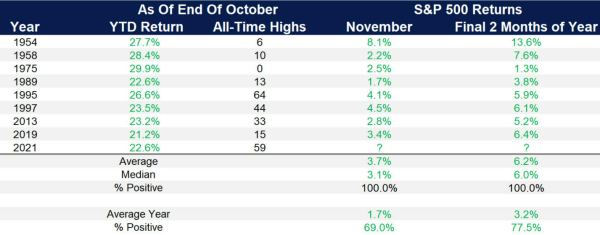
According to Bespoke Investment Group, over the last decade, there have only been six months with gains as large as October 2021 (again the S&P 500 was up +6.9% on a price basis). November of last year was the last of those months when the index rose +10.8%. Bespoke looked over the history of the index and found that there have been 166 months in which the S&P 500 rose +5% or more for a month. The performance of the index over the subsequent month has also tended to outperform with a gain of +0.87% (and positive 65% of the time) versus +0.64% for all months. Moreover, Ryan Detrick of LPL Research, found that when the S&P 500 is up more than +20% heading into November (which has occurred 8 times since 1950) that stocks have never declined in November or for the final two months of the year.
A Strong First 10 Months Could Mean A Strong Final 2 Months
The S&P 500 tends to climb more when up +20% or more at the end of October
Source: FactSet, LPL Research.
Style Shift
Large Cap Growth dominated performance in October and is currently the top-performing style over the last three months. That’s a significant shift from earlier in the year when Small Cap Value dominated. As seen in the tables below, the YTD through October and 1 Year trailing performance show Small Value well ahead of larger-cap Value and Growth, even after Large Growth’s strength over the last three months. After Value beat Growth in 3 of the first five months of the year, Growth has now beat Value in four of the previous five months.
Suspending the Debt Limit Has Become a Common Solution
Federal debt, in trillions of dollars
Source: Bloomberg, FTSE Russell. Data as of 10/31/2021.
Earnings drive prices
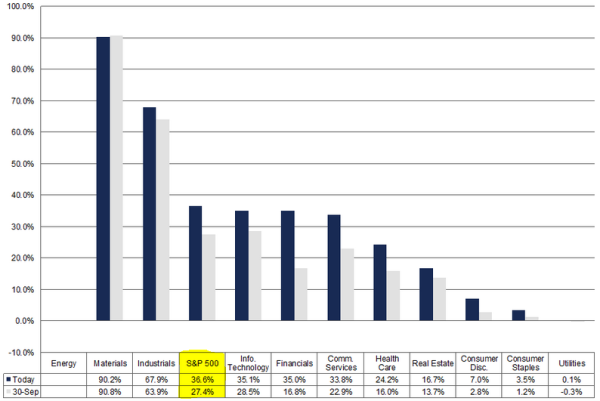
If there is one single reason why the stock market is doing so well, it is earnings. It’s no surprise that profits are improving compared to the pandemic depressed levels of Q1-2020, but earnings have consistently beat expectations during this recovery. According to John Butters at FactSet, “The fourth quarter marked the sixth consecutive quarter in which the bottom-up EPS estimates increased during the first month of the quarter, which is the longest streak since FactSet began tracking this metric in 2002.” The S&P 500 is reporting its third-largest year-over-year growth in earnings in Q3-2021 (36.6%) since Q2-2010, only exceeded by Q1 and Q2 of this year. 56% of companies in the S&P 500 had reported actual results for Q3 2021 to date at the end of October. Of those companies, 82% have reported actual EPS above estimates, which is above the five-year average of 76%. If 82% is the final percentage for the quarter, it will mark with the fourth-highest percentage of S&P 500 companies reporting a positive earnings surprise since FactSet began tracking this metric in 2008.
S&P 500 Earnings Growth for Q3-2021
Source: FactSet.
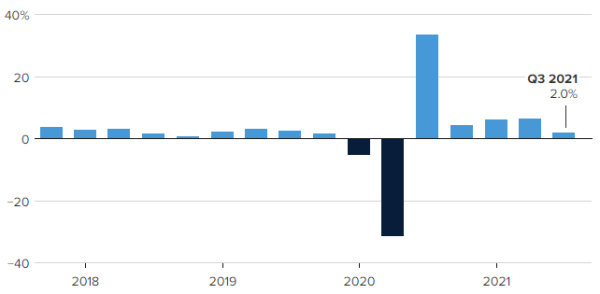
Economic growth rate slows to just 2.0% in Q3
The U.S. GDP growth rate decelerated sharply in Q3-2021, to an annualized 2.0% (well below Wall Street estimates that were generally at 3.0%-4.0%). Gross Domestic Product (GDP) is the sum of all the goods and services produced in the U.S. GDP growth averaged 6.5% in the first half of 2021. It is the slowest quarterly increase since the end of the 2020 recession. Supply chain issues have depleted inventories, higher commodity prices have pressured residential investment, and a substantial deceleration in consumer spending with a surge in the Delta Variant during the quarter all inhibited the economy’s expansion. It’s important to keep in mind that the GDP report is backward-looking and most economists are looking for GDP growth to rebound in the quarters ahead.
U.S. Gross Domestic Product (GGP), change from previous quarter
Source: Bureau of Economic Analysis, CNBC. Data is seasonally adjusted at an annual rate.
Inversion Perversion
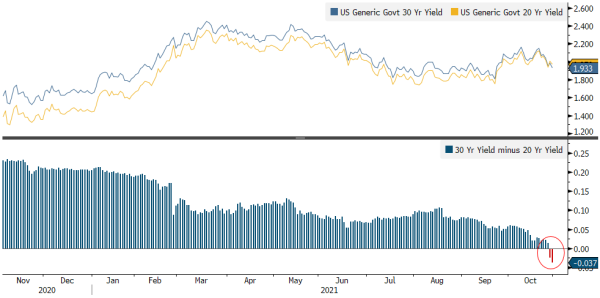
Guggenheim investments points out that the long end of the U.S. Treasury curve has inverted, with 30-year yields falling below 20-year yields for the first time since 2009. They believe that fed funds rate hikes will begin in the fourth quarter of 2022. Until recently most strategists didn’t expect rate hikes to begin until 2023. They suspect that the flattening of the yield curve could be an indicator that the Fed will raise rates to a degree that could threaten another recession in a few years. History shows that an inverted 20s/30s curve on its own does not necessarily predict a recession, but a flat forward yield curve has been a stronger indicator. The three-year forward 3-month/10-year swap curve stands at just 26 basis points and based on data from the last three business cycles, that level has historically preceded recessions by an average of 28 months… something to watch closely moving forward.
The Long End of the Treasury Curve Has Inverted for the First Time Since 2009
20-year/30-year Treasury Yields (Top) and Resulting Yield Curve (Bottom)
Source: Bloomberg.
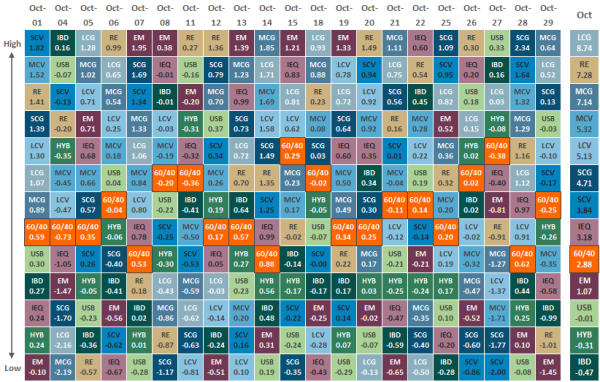
Asset Class Performance
The Importance of Diversification
Diversification mitigates the risk of relying on any single investment and offers a host of long-term benefits, such as lowering portfolio volatility, improving risk-adjusted returns, and helping investments to compound more effectively.
Source: Bloomberg. Asset‐class performance is presented by using market returns from an exchange‐traded fund (ETF) proxy that best represents its respective broad asset class. Returns shown are net of fund fees for and do not necessarily represent performance of specific mutual funds and/or exchange-traded funds recommended by The Retirement Planning Group. The performance of those funds may be substantially different than the performance of the broad asset classes and to proxy ETFs represented here. U.S. Bonds (iShares Core U.S. Aggregate Bond ETF); High‐Yield Bond (iShares iBoxx $ High Yield Corporate Bond ETF); Intl Bonds (SPDR® Bloomberg Barclays International Corporate Bond ETF); Large Growth (iShares Russell 1000 Growth ETF); Large Value (iShares Russell 1000 Value ETF); Mid Growth (iShares Russell Mid-Cap Growth ETF); Mid Value (iShares Russell Mid-Cap Value ETF); Small Growth (iShares Russell 2000 Growth ETF); Small Value (iShares Russell 2000 Value ETF); Intl Equity (iShares MSCI EAFE ETF); Emg Markets (iShares MSCI Emerging Markets ETF); and Real Estate (iShares U.S. Real Estate ETF). The return displayed as “Allocation” is a weighted average of the ETF proxies shown as represented by: 30% U.S. Bonds, 5% International Bonds, 5% High Yield Bonds, 10% Large Growth, 10% Large Value, 4% Mid Growth, 4% Mid Value, 2% Small Growth, 2% Small Value, 18% International Stock, 7% Emerging Markets, 3% Real Estate.
Chris Bouffard is CIO of The Retirement Planning Group (TRPG), a Registered Investment Adviser. He has oversight of investments for the advisory services offered through TRPG.
Disclaimer: Information provided is for educational purposes only and does not constitute investment, legal or tax advice. All examples are hypothetical and for illustrative purposes only. Past performance of any market results is no assurance of future performance. The information contained herein has been obtained from sources deemed reliable but is not guaranteed. Please contact TRPG for more complete information based on your personal circumstances and to obtain personal individual investment advice.

