Market Performance Summary
After posting solid returns in October, stocks maintained their momentum in November on weaker-than-expected inflation, lower Treasury yields, and a declining U.S. dollar. That recipe also served bonds nicely with both U.S. and international bonds having their best months since the global financial crisis. In fact, no major asset classes fell in November.
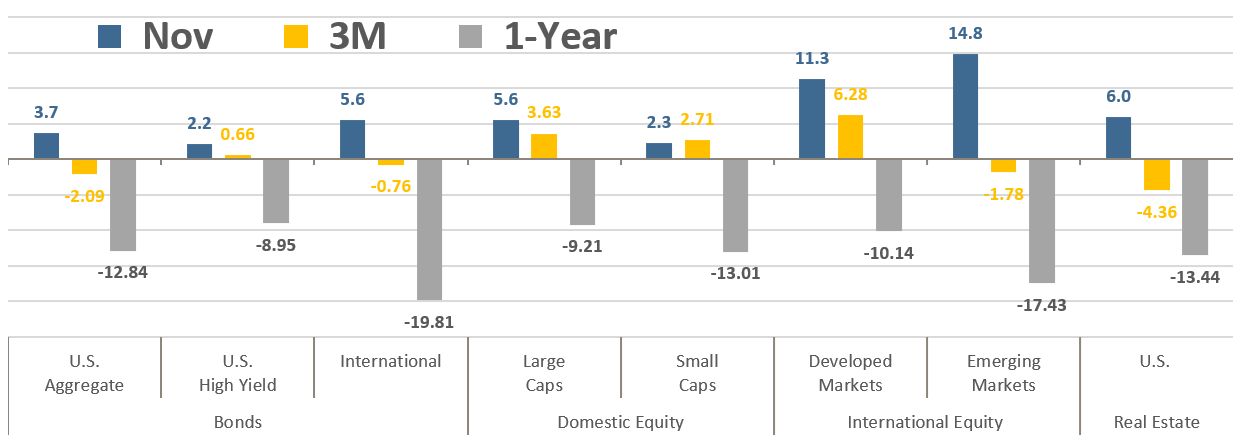
Asset Class Total Returns
Source: Bloomberg, as of November 30, 2022. Performance figures are index total returns: U.S. Bonds (Barclays U.S. Aggregate Bond TR), U.S. High Yield (Barclays U.S. HY 2% Issuer-Capped TR), International Bonds (Barclays Global Aggregate ex USD TR), Large Caps (S&P 500 TR), Small Caps (Russell 2000 TR), Developed Markets (MSCI EAFE NR USD), Emerging Markets (MSCI EM NR USD), Real Estate (FTSE NAREIT All Equity REITS TR).
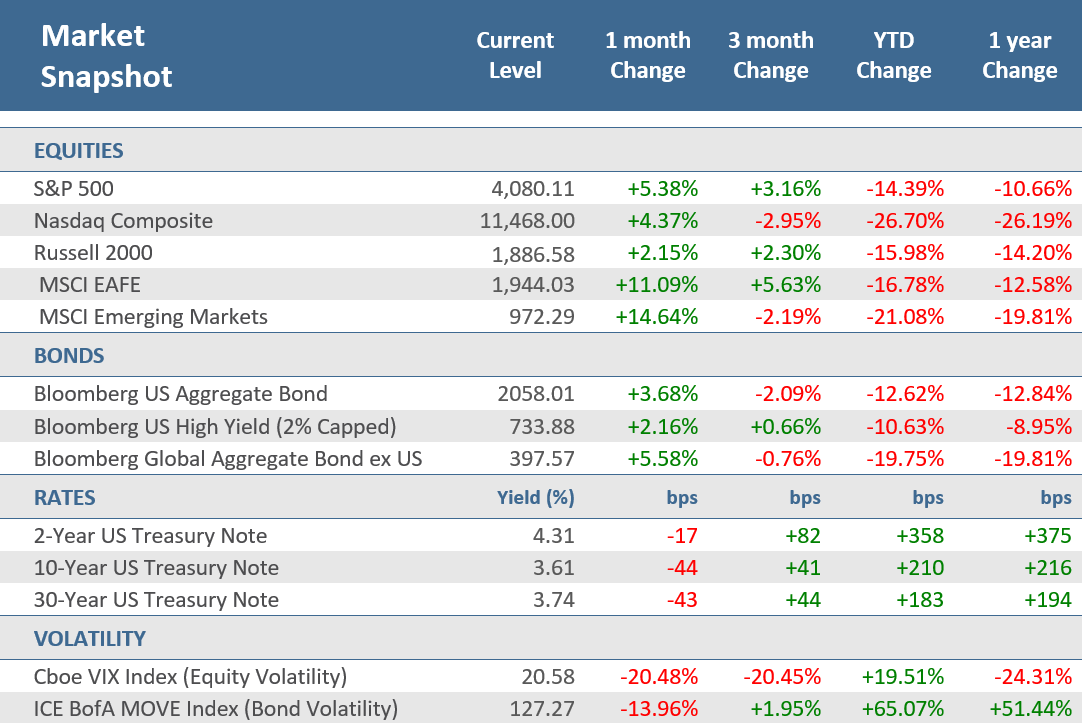
Equity markets continued their recovery from October’s lows, with the S&P 500 gaining +5.6% in November, and with the +8.0% it posted in October, it was the first back-to-back positive months since August of 2021. Developed market stocks fared even better, with the MSCI EAFE Index popping +11.3% in November, their best month since November 2020. But it was emerging market stocks that really shined in November, with the MSCI Emerging Markets Index surging +14.8% after being the only major equity group to lose ground in October. That was the best single month for emerging markets since May 2009, and the first time in three months that it outperformed developed market stocks. Bonds also registered a strong month as yields in the U.S. and overseas retreated significantly, leading to a +3.7% rally for the Bloomberg U.S. Aggregate Bond Index and +5.6% for the Bloomberg Global Aggregate Bond ex U.S. Index. That was the first time in four months that U.S. bonds were positive. U.S. investment grade corporate bonds led the way there, advancing +5.2% in November, their best month since April 2020.
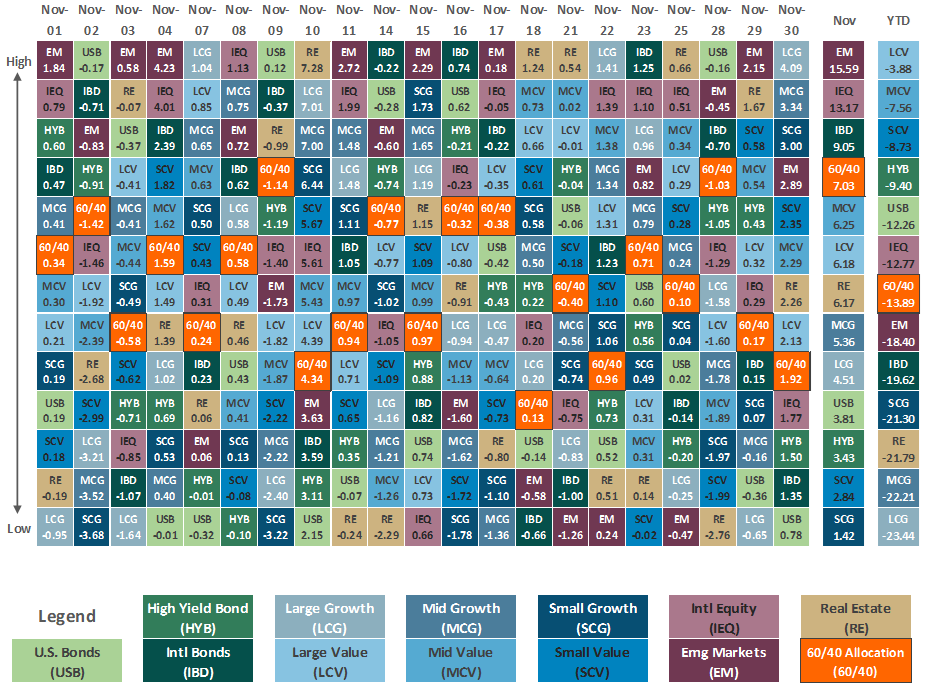
At the beginning of November, mounting concerns about persistently high inflation and continued aggressive central bank tightening were weighing on investors. And central banks did deliver another round of big rate hikes. The Federal Reserve (Fed) and the Bank of England (BoE) both raised their policy rates by 75 basis points (bps) to 4.0% and 3.0% respectively. It was the fourth straight 75 bps hike by the Fed. However, despite headwinds from tighter monetary policy, investor spirits were significantly boosted after the release of U.S. consumer inflation data for October on November 10. The CPI’s (Consumer-Price Index) +7.7% year-on-year increase, while historically high, was below consensus expectations, and fueled a furious rally on the hopes that the Fed could slow the pace of their aggressive rate hikes. Of course, the bond market also cheered the tamer-than-expected inflation data and Treasury yields plunged on the release of the data. As seen in the table on the last page of this report, a hypothetical portfolio of 60% equity securities and 40% bonds, surged +4.3% on that day alone, contributing more than 60% of the 60/40 portfolio’s entire month’s gain of +7.0%.
Source: Bloomberg, as of November 30, 2022.
Price Returns for Equity, Total Returns for Bonds.
* The term basis points (bps) refers to a common unit of measure for interest rates and other percentages in finance. One basis point is equal to 0.01%. Bond prices and bond yields are inversely related. As the price of a bond goes up, the yield decreases.
Quick Takes
INFLATION JUBILATION.
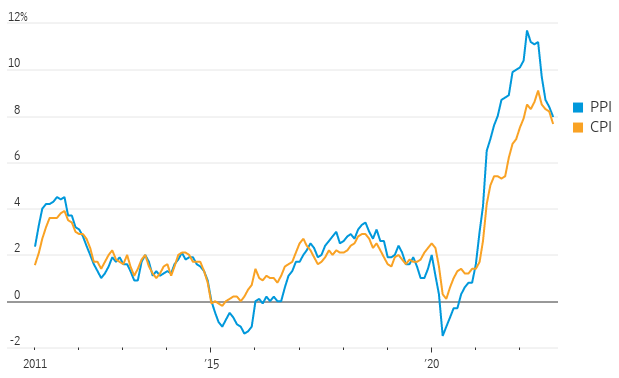
As mentioned above, the primary catalyst for the November rally was softer-than-expected October inflation data. The pace of inflation eased from nearly a four-decade high in October with the Consumer-Price Index (CPI) up +7.7% from the prior year. Yes, that is still historically high, but it was the smallest annual increase since January, down from a +8.2% annual increase in September, and below expectations for +7.9%. Core CPI, which excludes the more volatile food and energy components, was up +6.3% from last year, also below expectations (+6.5), and lower than September’s unadjusted +6.6% rise. And it wasn’t just consumer prices whose pace eased in October. The week after the CPI report pleased investors, the pace of wholesale price increases also slowed for the second straight month. The Producer-Price Index (PPI), which generally reflects supply conditions in the economy, climbed +8.0% from the prior October—which like CPI, remains historically high—but marked a moderation from +8.4% in September, and was down sharply from +11.7% in March, the highest level since data began in 2010. Core PPI, again excluding food and energy, was up +6.7% from last year, below expectations of +7.2% and September’s downwardly revised +7.1%. The combination of CPI and PPI both falling for successive months now may be signaling that inflation in the U.S. has peaked and likely leaves the Fed on track for a +0.5-percentage-point rate hike in December, not the 0.75-point hike that many feared.
Pace of Inflation Eases
Producer-Price Index (PPI) and Consumer-Price Index (CPI), 12-month change
Source: Labor Department, The Wall Street Journal.
DOLLAR EASES.
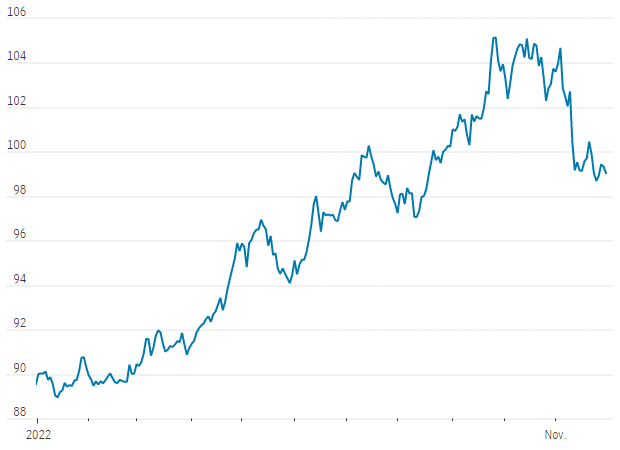
The WSJ Dollar Index, which measures the U.S. dollar against a basket of other global currencies, fell -5% in November, its largest monthly percentage decline since July 2010. The greenback has soared this year as the Federal Reserve embarked on its most aggressive policy tightening campaign in decades. Higher interest rates typically make a currency more attractive to foreign investors. The WSJ Dollar Index is up +10% in 2022 but has trimmed gains in recent weeks as investors bet that the Federal Reserve will slow the pace of rate increases in the months ahead. Data suggesting U.S. inflation is slowing also weighed on the U.S. currency and allowed the beaten-down currencies of other countries to claw back some of their losses for the year.
Dollar Drops in November
WSJ Dollar Index
Source: Dow Jones Markets Data.
HERE COMES THE EARNINGS CRUNCH.
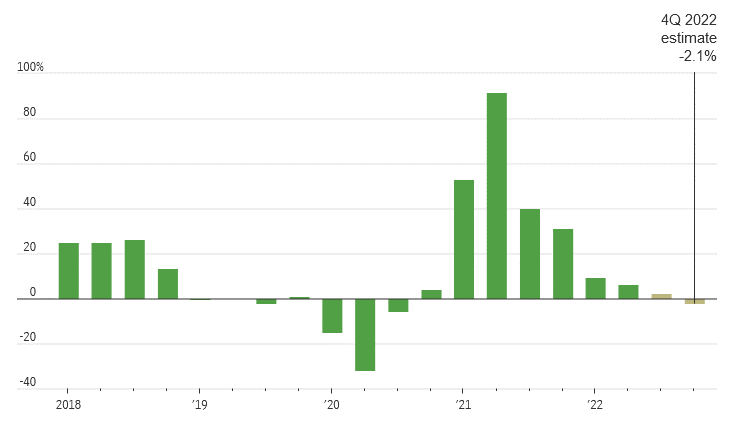
Even as investors relish the prospect of smaller rate hikes from the Federal Reserve, earnings are becoming more of a threat. The recent optimism fueling markets may vanish as corporate earnings are pressured. Earlier this year, Wall Street analysts were forecasting that S&P 500 companies’ fourth-quarter earnings would rise. Now they think earnings will fall. In fact, analysts have been slashing earnings estimates at a pace rarely seen outside recessions—and still may be too optimistic. The 12-month forward prediction for S&P 500 earnings per share is down more than -3% since June, and 2023’s forecast is down -8%. The only significantly bigger drop outside a recession was in 2015 when the Fed was moving toward its first rate rise in nine years.
Stocks are up, but Earnings may weigh them down.
S&P 500 quarterly earnings, change from a year earlier
Note: 3Q 2022 earnings growth is based on a blend of actual results and estimates. 4Q 2022 earnings growth based on estimates. As of Nov. 25, 2022.
Source: FactSet, The Wall Street Journal.
GOOD NEWS FOR INVESTORS: DIVIDENDS ARE SOARING.
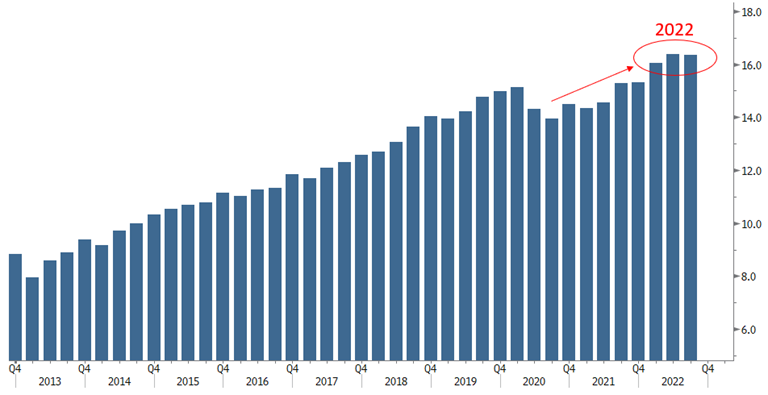
It’s been a challenging year for investors in 2022, but one silver lining can be found in dividend payouts. Dividend payouts are at an all-time high, up +6.7% in the third quarter to a record $146.2 billion in the U.S. and higher by +7% globally, to $415.9 billion, according to asset manager Janus Henderson using its in-house Janus Henderson Global Dividend Index of 1,200 stocks. U.S. investors can thank financials, which accounted for almost 40% of the growth in dividends, the largest single contribution by the industry group. Internationally, oil companies and their record profits accounted for a large measure of dividend growth. Excluding the effect of the strong dollar, international dividend growth was even stronger in the third quarter, expanding by +10%. Janus upgraded its dividend outlook as a result of the third quarter. It now forecasts global dividends of $1.56 trillion, up an underlying +8.9% year-over-year, vs a $1.53 trillion estimate previously. In mid-August, Janus forecasted underlying dividend growth at +8.5%. The long-term dividend growth average is +5%-6%. As shown in the chart below, the companies of the S&P 500 Index will record an all-time high in dividend payouts in 2022. Through November 30, the companies of the S&P 500 had paid out $60.5 per share, which already surpasses the 2021 record total of $59.5. Nearly 190 U.S.-listed companies stopped paying dividends in 2020 to save cash during the pandemic, according to a data provider S&P Global Market Intelligence. Thirty-nine went back to paying them that same year, 53 followed reinstated dividends in 2021, and 23 more have done so in 2022.
Record High Payouts in 2022
S&P 500 Quarterly Dividends Per Share
Source: Bloomberg.
SAVINGS SHRINK.
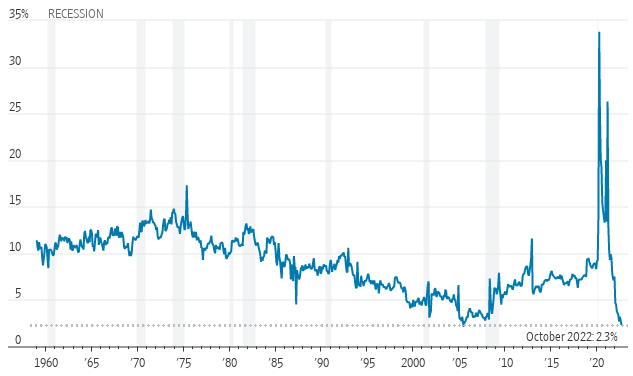
How long can the savings consumers built up during the pandemic keep their spending going? Economists estimate that heading into the third quarter, households still had ranged from $1.2 to $1.8 trillion in “excess savings”—the amount above what they would have saved had there been no pandemic. Consumers have built up unprecedented savings during the Covid-19 pandemic, thanks to government stimulus and due to much fewer opportunities to spend due to the Covid-related restrictions and lockdowns. But there may be only nine to 12 months left of that savings buffer. As seen in the chart below, before the pandemic hit, households saved around 8.8% of their disposable income. That saving rate jumped to 16.8% in 2020, the highest annual saving rate on record. But in 2022, that rate has been below 4% for seven straight months and in October it stood at 2.3%, near its lowest level since the 2008 financial crisis. This suggests that consumers are spending more and saving less of their monthly income than normal because inflation forces them to spend more on higher-priced goods and services. Consumers had also used their hefty savings to pay down credit-card debt. There are signs that have changed too. The Federal Reserve Bank of New York said credit-card balances increased 15% year-over-year in the third quarter, the largest increase in over two decades. The rate of delinquency, that is debt more than 30 days past due, rose across income groups. With the employment market still strong, economists don’t expect consumers to dramatically rein in their spending until they see unemployment rising and become concerned about losing their jobs. Economists surveyed by The Wall Street Journal last month expected employers will start cutting jobs in the second and third quarters of next year. Any material rise in unemployment, and further draining of savings, may pose a headwind for markets in 2023.
Is consumer spending on borrowed time?
U.S. personal saving rate
Note: Seasonally adjusted
Source: Commerce Department, The Wall Street Journal.
TIS THE SEASON.
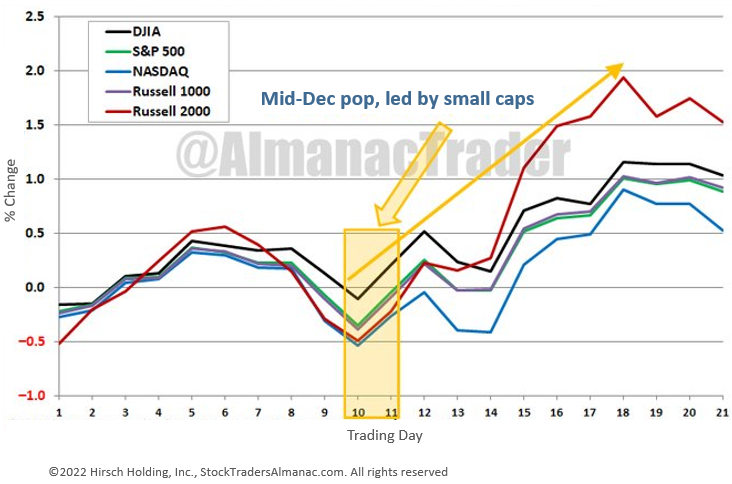
We’ve discussed how the fourth quarter is typically a seasonally strong period for the stock market, and that tends to be even stronger in mid-term election years. That has already borne itself out this year, with stocks ending the longest streak without back-to-back positive months since 1977 after October’s and November’s gains. Can stocks make it three months in a row? Recent history suggests it is possible. The typical December seasonal trading pattern begins with a slight advance, then a few days of consolidation into mid-month, then comes the tendency for holiday cheer to kick in and push indexes higher toward the end of the year. Sam Stovall, CFRA Research chief investment strategist, expects a year-end rally, “December since World War II has been the best month of the year not only in terms of average price change but also batting average, frequency of advance.”
December Seasonal Trading Pattern
Recent 21-Year December Market Performance (2001 – 2021)
Asset Class Performance
The Importance of Diversification. Diversification mitigates the risk of relying on any single investment and offers a host of long-term benefits, such as lowering portfolio volatility, improving risk-adjusted returns, and helping investments to compound more effectively.
Source: Bloomberg.
Asset‐class performance is presented by using market returns from an exchange‐traded fund (ETF) proxy that best represents its respective broad asset class. Returns shown are net of fund fees for and do not necessarily represent performance of specific mutual funds and/or exchange-traded funds recommended by The Retirement Planning Group. The performance of those funds may be substantially different than the performance of the broad asset classes and to proxy ETFs represented here. U.S. Bonds (iShares Core U.S. Aggregate Bond ETF); High‐Yield Bond (iShares iBoxx $ High Yield Corporate Bond ETF); Intl Bonds (SPDR® Bloomberg Barclays International Corporate Bond ETF); Large Growth (iShares Russell 1000 Growth ETF); Large Value (iShares Russell 1000 Value ETF); Mid Growth (iShares Russell Mid-Cap Growth ETF); Mid Value (iShares Russell Mid-Cap Value ETF); Small Growth (iShares Russell 2000 Growth ETF); Small Value (iShares Russell 2000 Value ETF); Intl Equity (iShares MSCI EAFE ETF); Emg Markets (iShares MSCI Emerging Markets ETF); and Real Estate (iShares U.S. Real Estate ETF). The return displayed as “Allocation” is a weighted average of the ETF proxies shown as represented by: 30% U.S. Bonds, 5% International Bonds, 5% High Yield Bonds, 10% Large Growth, 10% Large Value, 4% Mid Growth, 4% Mid Value, 2% Small Growth, 2% Small Value, 18% International Stock, 7% Emerging Markets, 3% Real Estate.
* The term basis points (bps) refers to a common unit of measure for interest rates and other percentages in finance. One basis point is equal to 0.01%. Bond prices and bond yields are inversely related. As the price of a bond goes up, the yield decreases.
Chris Bouffard is CIO of The Retirement Planning Group (TRPG), a Registered Investment Adviser. He has oversight of investments for the advisory services offered through TRPG.
Disclaimer: Information provided is for educational purposes only and does not constitute investment, legal or tax advice. All examples are hypothetical and for illustrative purposes only. Past performance of any market results is no assurance of future performance. The information contained herein has been obtained from sources deemed reliable but is not guaranteed. Please contact TRPG for more complete information based on your personal circumstances and to obtain personal individual investment advice.

