Quick Takes
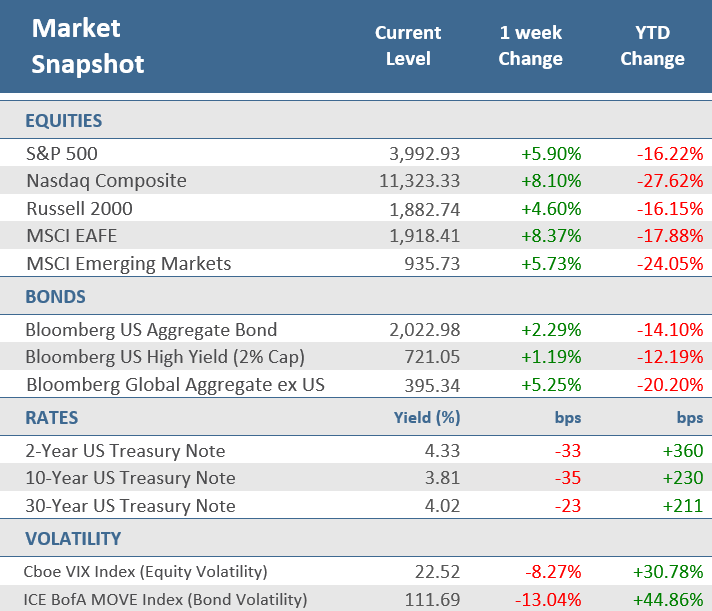
- U.S. stocks posted their biggest daily gain since March 2020 following tepid inflation data from October’s Consumer Price Index (CPI), with the S&P 500 Index up +5.9% for the week. The Nasdaq Composite Index recorded its best week since March, with a +8.1% gain.
- The slower-than-expected pace of inflation also sent 2- and 10-year Treasury yields to their biggest one-day plunge in over a decade, to end the week at 4.33% and 3.81% respectively. The -33 and -35 basis point respective weekly declines were the largest since March 2020
- The pace of inflation eased from nearly a four-decade high as the October CPI rose +7.7% from last year. That’s still historically high, but it was the smallest annual increase since January and below the +8.2% rise in September as well as expectations for +7.9%.
Stocks Surge and Yield Sink as Inflation Cools
U.S. stocks posted their best single day since March 2020 on Thursday after a tepid October inflation reignited hopes that the Federal Reserve would slow the pace of its interest-rate increases. The slower-than-expected pace of inflation also sent two- and 10-year Treasury yields to their biggest one-day plunge in over a decade, and the U.S. dollar saw its biggest one-day slide since the 2008-2009 financial crisis. Thursday’s market action was a stark reminder of how much weight investors are putting on the path of inflation this year.
The one-day wonder on Thursday helped the S&P 500 Index advance +5.9% for the week, its best week since June. The prospect that interest rate hikes might soon taper off had investors returning to growth stocks, with the Nasdaq Composite recording its best week, +8.1%, since March. The Nasdaq is dominated by the technology sector which surged +10% over the week, its best weekly performance since April 2020. Small-cap stocks trailed the other U.S. indices, but the Russell 2000 Index was still up +4.6% for the week. The upside performance in the markets occurred despite a dramatic drop in cryptocurrencies after the cryptocurrency exchange FTX announced the resignation of its founder and CEO and that it was filing for bankruptcy.
The U.S. bond markets were closed Friday in observance of the Veteran’s Day holiday, but after Thursday’s favorable inflation report, the yield on the 2-year Treasury Note fell to 4.33% and the yield on the 10-year Treasury Note settled at 3.81%. The -33 and -35 basis point respective declines for the 2- and 10-year Treasury yields were the largest weekly declines since March 2020. As a result, the Bloomberg Aggregate Bond Index had its largest weekly return since March 2020, a +2.3% gain.
The combination of the drop in yields and the largest weekly decline for the U.S. dollar since March 2020, was a bonanza for non-U.S. stocks and bonds. Developed market international stocks had their best week since March 2020 with the MSCI EAFE Index rising +8.4%. The Bloomberg Global Aggregate ex-US Bond Index gained +5.2%, its best week since October 1998.
Despite the robust market performance over the week, the earnings outlook is dimming as the economy slows, which could result in further cuts to earnings estimates and add downside pressure to stocks. The Q3-2022 earnings season is winding down, and with 91% of companies in the S&P 500 having reported earnings, weakness is starting to materialize across a broader array of industries. According to FactSet data, of those reported, 69% beat earnings estimates, which is below the 5- and 10-year averages of 77% and 73% respectively. In aggregate, earnings have exceeded estimates by +1.8%, which is also well below the 5- and 10-year averages of +8.7% and +6.5%. Stocks will need some support from earnings to sustain the gains they get from softening inflation.
Chart of the Week
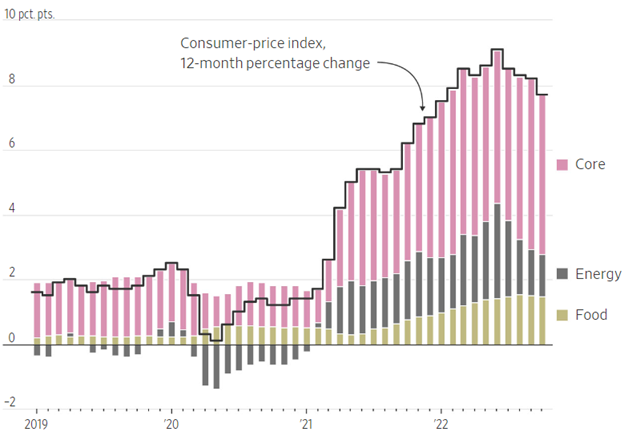
The pace of inflation eased from nearly a four-decade high in October as the Consumer Price Index (CPI) rose +7.7% from last year. That is still historically high, but it was the smallest annual increase since January, down from a +8.2% annual increase in September, and below expectations for +7.9%. Month-over-month, CPI rose +0.4% in October, which was also below expectations of a +0.6% gain and in line with September’s unrevised increase. Core CPI, which excludes the more volatile food and energy components, was up +6.3% from last year, below expectations for a +6.5% gain, and lower than September’s unadjusted +6.6% rise. Month-over-month, Core CPI was up +0.3% in October, below expectations of +0.5%, and under September’s unadjusted +0.6% rise. The Bureau of Labor Statistics (BLS) said the index for shelter contributed over half of the monthly increase, and gasoline and electricity prices rose, though natural gas prices decreased. Food prices also increased, along with recreation, new vehicles, and personal care. Prices for used cars and trucks, medical care, apparel, and airline fares declined. The cooler-than-expected inflation report likely leaves the Fed on track for a +0.5-percentage-point rate hike in December, not the 0.75-point hike that many fear.
Inflation Jubilation
The annual pace of inflation unexpectedly eased in October
Note: Percentage-point contributions to 12-month percentage changes in the consumer price index.
Source: Labor Department, The Wall Street Journal.
Economic Review
- September Consumer Credit showed consumers borrowed $25.0 billion, less than the $30.0 billion expected, and August was revised downward to $30.2 billion from the originally reported $32.2 billion. Non-revolving debt—includes student loans and loans for vehicles and mobile homes—grew by $16.6 billion, up +5.7% over last year, while revolving debt—includes credit cards—grew by $8.4 billion, an +8.7% increase over last year.
- The October National Federation of Independent Business (NFIB) Small Business Optimism Index fell to 91.3, matching expectations, but below September’s 92.1. It was the tenth-consecutive month below the 48-year average of 98, with 33% of business owners saying inflation remains their single most important problem. The NFIB said, “Owners continue to show a dismal view about future sales growth and business conditions, but are still looking to hire new workers. Inflation, supply chain disruptions, and labor shortages continue to limit the ability of many small businesses to meet the demand for their products and services.”
- The preliminary November University of Michigan Consumer Sentiment Index dropped more than expected, falling to 54.7 from October’s final reading of 59.9, well below expectation for a slight decrease to 59.5. The index remained above June’s record low, but the current conditions component saw a noticeable decline, joining a more modest decrease in the expectations component. The 1-year inflation outlook ticked lower to 5.0% from 5.1% in October, and the 5-10-year inflation outlook rose to 3.0% from 2.9%.
- The weekly MBA Mortgage Application Index fell -0.1% from the prior week’s -0.5% decline. It was the seventh straight weekly decline as the Refinance Index was down -3.5% from last week and the Purchase Index was up +1.3% for the week. The decrease came as the average 30-year mortgage rate rose 8 bps to 7.14% and is up 3.98 percentage points versus a year ago.
- Weekly Initial Jobless Claims increased by 7,000 to 225,000 for the week ended November 5, above expectations for 220,000, and the prior week’s upwardly revised 218,000. Continuing Claims for the week ended October 29 rose by 6,000 to 1,493,000, higher than expectations of 1,492,000.
The Week Ahead
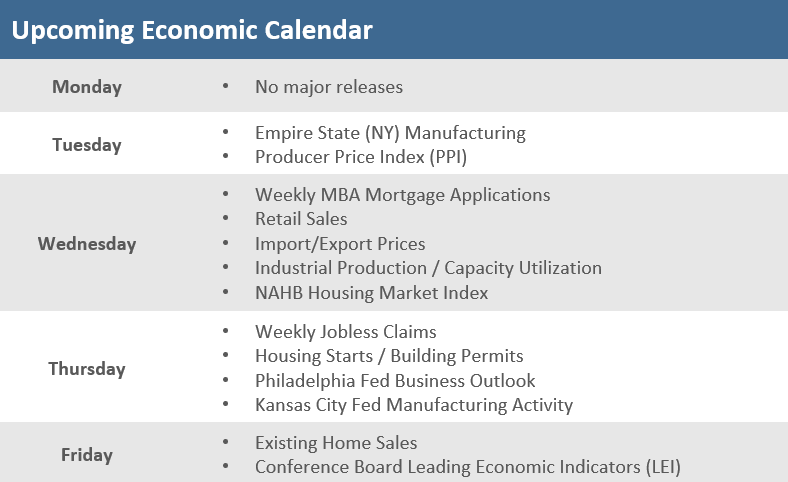
The U.S. consumer will be in focus next week with the government’s report on Retail Sales set for Wednesday and, as the Q3 earning season heads down the home stretch, earnings reports include a slate of retailers like Walmart and Target. The economic calendar includes a few regional Fed manufacturing reports from New York, Philadelphia, and Kansas City. Builder sentiment, building permits, and housing starts will provide an update on what has been an increasingly sharp deterioration in the housing market. There is also a flurry of Fed speakers, who will be watched for their views on inflation and the Fed’s rate hiking path.
Did You Know?
SPEED BUMP – The “velocity of money” in the United States was 1.126 in the third quarter of 2022, near the lowest ever recorded level which was 1.104 in the second quarter of 2020. The fastest “velocity of money” level ever recorded in U.S. history was 2.198 in the third quarter of 1997. “Velocity of money” measures the rate at that money is exchanged in the U.S. economy for goods and services (source: Federal Reserve Bank of St. Louis, The Wall Street Journal).
CHINA BILLIONAIRES DROP – Zero-Covid, plunging stock markets and a severe property slump has erased hundreds of billions of dollars from the net worth of China’s tycoons. Forbes reported that China’s 100 richest people saw their collective wealth decline by $573 billion since last year’s rankings, the biggest drop since the magazine began tracking the country’s wealthiest more than two decades ago (source: Forbes, The Wall Street Journal).
NOT REALLY CAPITALISTS – Based on data through 2021, the Chinese government has owned between 25% to 28% of the entire Chinese economy over each of the last 21 years (source: Gavekal Research, MFS).
This Week in History
ACCOUNTING ORIGINS – On November 10, 1494, the first edition of Luca Pacioli’s Summa de Arithmetica, Geometria, Proportioni et Proportionalita was printed in Venice. Corporate balance sheets and income statements can trace their heritage to this day, as the book contained 36 brief chapters on accounting and, for the first time, popularized the concept of double-entry bookkeeping, which offsets assets against liabilities and revenues against expenses (Source: The Wall Street Journal).
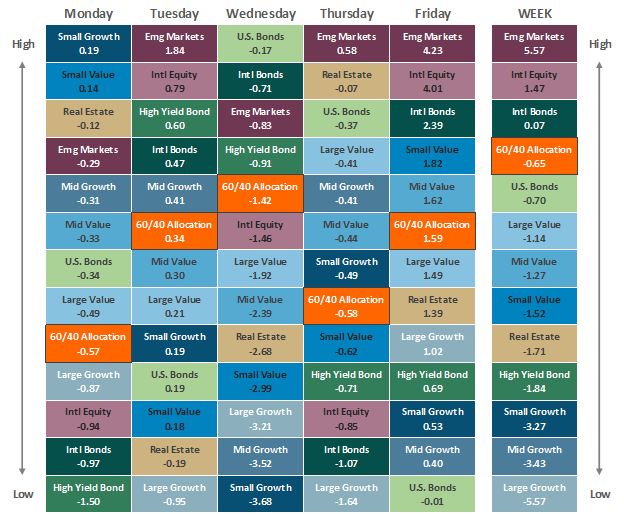
Asset Class Performance
The Importance of Diversification. Diversification mitigates the risk of relying on any single investment and offers a host of long-term benefits, such as lowering portfolio volatility, improving risk-adjusted returns, and helping investments to compound more effectively.
Source: Bloomberg.
Asset‐class performance is presented by using market returns from an exchange‐traded fund (ETF) proxy that best represents its respective broad asset class. Returns shown are net of fund fees for and do not necessarily represent performance of specific mutual funds and/or exchange-traded funds recommended by The Retirement Planning Group. The performance of those funds may be substantially different than the performance of the broad asset classes and to proxy ETFs represented here. U.S. Bonds (iShares Core U.S. Aggregate Bond ETF); High‐Yield Bond (iShares iBoxx $ High Yield Corporate Bond ETF); Intl Bonds (SPDR® Bloomberg Barclays International Corporate Bond ETF); Large Growth (iShares Russell 1000 Growth ETF); Large Value (iShares Russell 1000 Value ETF); Mid Growth (iShares Russell Mid-Cap Growth ETF); Mid Value (iShares Russell Mid-Cap Value ETF); Small Growth (iShares Russell 2000 Growth ETF); Small Value (iShares Russell 2000 Value ETF); Intl Equity (iShares MSCI EAFE ETF); Emg Markets (iShares MSCI Emerging Markets ETF); and Real Estate (iShares U.S. Real Estate ETF). The return displayed as “Allocation” is a weighted average of the ETF proxies shown as represented by: 30% U.S. Bonds, 5% International Bonds, 5% High Yield Bonds, 10% Large Growth, 10% Large Value, 4% Mid Growth, 4% Mid Value, 2% Small Growth, 2% Small Value, 18% International Stock, 7% Emerging Markets, 3% Real Estate.
* The term basis points (bps) refers to a common unit of measure for interest rates and other percentages in finance. One basis point is equal to 0.01%. Bond prices and bond yields are inversely related. As the price of a bond goes up, the yield decreases.


