Quick Takes
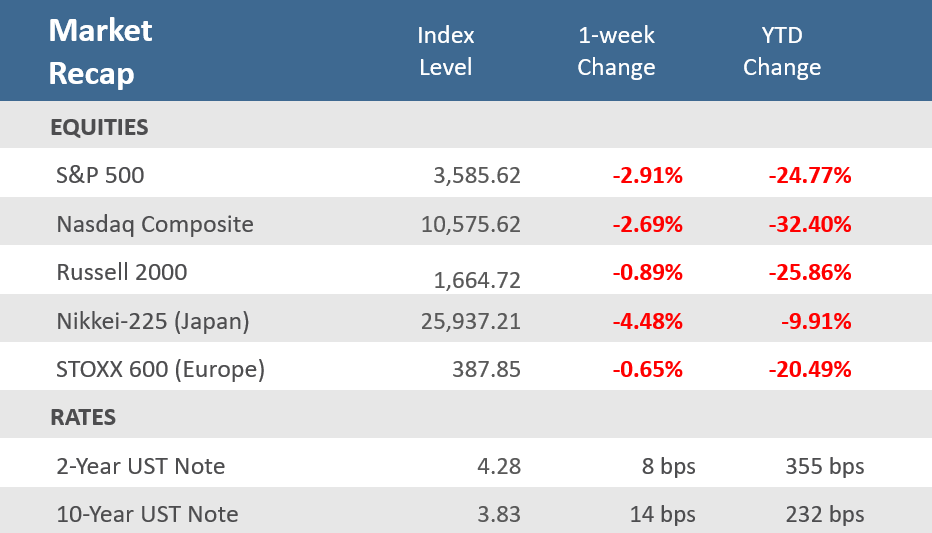
- Markets were roiled by growing fears of tightening monetary policy from an aggressive-talking Federal Reserve that shows no signs of slowing down rate hikes. The major U.S. stock averages posted sharp losses for the week, their third-straight week of declines. The S&P 500 fell -2.9% for the week, to levels last seen in 2020.
- Bond and currency markets were jolted by a mid-week announcement from the Bank of England that it will buy long-term bonds to try to stabilize its financial markets. For the week, the 10-year US Treasury yield rose 3.83%, while the 2-year US Treasury yield was up to 4.28%. The Bloomberg Aggregate Bond Index finished the week down -1.0%.
- Economic news was mixed for the week, with mortgage applications and pending home sales disappointing as mortgage rates hit a 15-year high. The final University of Michigan Consumer Sentiment Index for September was unexpectedly revised lower, but the Conference Board’s Consumer Confidence Survey beat expectations with a solid increase.
Markets end the month, and quarter, with another week of losses.
Markets were roiled by growing fears of tightening monetary policy from an aggressive-talking Federal Reserve that shows no signs of slowing down rate hikes. The major U.S. averages posted sharp losses for the week, their third-straight week of declines. The S&P 500 slid -2.9% for the week, the Nasdaq fell -2.7%, and the small-cap Russell 2000 dipped -0.9%. Friday also marked the last day of September as well as the third quarter. September did not fail to live up to its reputation as historically the worst month for stocks, as the S&P 500 tumbled -9.3%, the Nasdaq lost -10.5%, and the Russell 2000 lost -9.7%. For the third quarter, the S&P 500 fell -5.3%, the Nasdaq slid -4.1%, and the Russell dipped -2.5%. For the S&P, Nasdaq, and Russell it was the first three-quarter losing streak since 2009. The S&P 500 is now at levels last seen since 2020, while the continued malaise in Technology stocks pushed the Nasdaq past a -30% year-to-date loss.
The volatility wasn’t left to just equities, with bond and currency markets also jolted by a mid-week announcement from the Bank of England (BoE) that it will buy long-term bonds to try to stabilize its financial markets. Bloomberg noted that the BoE took the actions after warnings from investment banks and fund managers of the stress caused by the dramatic moves in the bond and currency markets, as the British pound and the euro have dropped sharply this year. As a result, Treasury yields soared, particularly on the short end of the yield curve, and the U.S. dollar continued to rally. During the week, the yield on the 10-year Treasury briefly soared to a nearly 14-year high, topping 4%, before reporting its steepest intraday decline since 2020 on Wednesday. The 10-year US Treasury yield finished the week up 14 basis points at 3.83%, while the 2-year US Treasury yield was up 8 basis points to 4.28%. The Bloomberg Aggregate Bond Index finished the week down -1.0%, putting it down -4.3% for September and -4.8% for the third quarter.
Economic news was mixed for the week, as mortgage applications continued to decline and pending home sales as mortgage rates hit a 15-year high, although new home sales were upbeat. The final University of Michigan Consumer Sentiment Index for September was unexpectedly revised lower, but the Conference Board’s Consumer Confidence Survey beat expectations with a solid increase.
Ultimately, the likelihood that the Federal Reserve will keep tightening at its next two meetings this year remains the biggest headwind for global markets. These fears were elevated further on Thursday by yet another signal that the jobs market remains firm as initial jobless claims, a proxy for layoffs, fell to their lowest level since April, and then on Friday an inflation report that is closely watched by the Federal Reserve showed that prices continued to increase at a rapid pace. That prompted Fed Vice Chair Lael Brainard to emphasize the need to bring down inflation, saying the Fed is “committed to avoiding pulling back prematurely” on restrictive monetary policy.
Chart of the Week
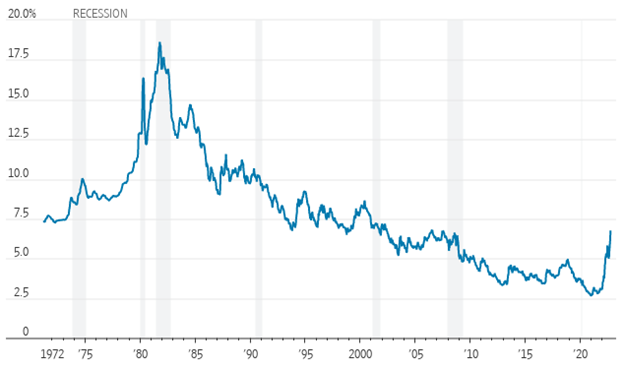
Mortgage rates rose to their highest level in more than 15 years, hitting a new high since the 2008-09 financial crisis, which adds pressure to the already cooling U.S. housing market. The average rate on a 30-year fixed mortgage climbed to 6.7%, according to a survey of lenders released Thursday by Freddie Mac. It was the highest rate since July 2007 and marked the sixth week in a row of rising mortgage rates.
15-Year Home Loan High
U.S. weekly average for 30-year fixed rate mortgage
Sources: Freddie Mac via St Louis Fed, The Wall Street Journal.
Economic Review
- The final look (of three) at Q2 Gross Domestic Product (GDP), the broadest measure of economic output, showed a quarter-over-quarter annualized rate of contraction of -0.6%, unrevised from the second release and in line with expectations. Q1 was unadjusted at a – 1.6% contraction. Personal consumption was revised higher to a +2.0% rise for Q2 from the previous estimate of a +1.5% gain and higher than expectations to be unrevised. Q1 personal consumption was adjusted lower to a +1.3% rise. On inflation, the GDP Price Index was revised higher to a +9.0% gain, beating expectations to be unrevised at an +8.9% increase, and the Core PCE Index, which excludes food and energy, was adjusted upward to a +4.7% advance, also ahead of expectations for an unadjusted +4.4% gain.
- The August PCE Deflator rose +0.3% for the month, beating expectations for a +0.1% rise and July’s unadjusted -0.1% dip. Compared to last year, the deflator was +6.2% higher, above expectations of +6.0%, and compared to the prior month’s upwardly adjusted +6.4%. Excluding food and energy, the PCE Core Price Index rose +0.6% for the month, above expectations of +0.5%, and July’s downwardly adjusted flat reading. The index was +4.9% higher year-over-year, above expectations of +4.7%, and July’s positively revised +4.7% rise.
- The Federal Reserve Bank of Chicago reported that the Chicago Fed National Activity Index (CFNAI) declined to 0.00 in August from 0.29 in July, upwardly revised from 0.27. The May and June readings were both negative. The CFNAI is a weighted average of 85 monthly indicators of national economic activity. It is constructed to have an average value of zero, with a positive index reading corresponding to growth above the trend and a negative index reading corresponding to growth below the trend. The index’s three-month moving average improved to 0.01 in August after holding steady month-over-month at -0.08 in July. The figure was down from a recent high of 0.48 in December. During the last 10 years, there has been a 76% correlation between the change in the Chicago Fed Index and quarterly growth in real GDP. Forty-six of the components contributed positively to the August index while 39 contributed negatively.
- The Chicago PMI fell in September into contraction territory (a reading below 50), to 45.7—the lowest since June 2020—from 52.2 in August, and below expectations for a slight decline to 51.8. The larger-than-expected drop came as new orders contracted at a faster pace, while production and employment both moved back into contraction territory. Prices paid rose at a slower pace but remained elevated.
- The Dallas Fed Manufacturing Index unexpectedly moved further into contraction territory (a reading below zero) for September. The index fell to -17.2 from -12.9 in August, far below expectations for an improvement to -9.0. The surprise deterioration came as the contraction for new orders increased, more than offsetting accelerated growth in production and shipments. Employment dipped but remained comfortably in expansion territory, and inflation pressures remained severely elevated, with prices paid accelerating, but did moderate in terms of prices received.
- The Richmond Fed Manufacturing Activity Index was unchanged in September, with a 0 level which is the demarcation point between expansion and contraction. The index rose from -8 in August and was well above forecasts calling for -10. New order volumes, capacity utilization, vendor lead time, and local business conditions all improved but remained in contraction territory. Shipments rose into expansion territory, and capital expenditures moved higher into expansion territory. Services expenditures, on the other hand, remained expansionary but did decrease.
- The final University of Michigan Consumer Sentiment Index for September was revised lower to 58.6, from the preliminary 59.5, where it was expected to remain. The downward revision came as the Current Conditions component of the survey was revised modestly higher from the initial estimate, while the Expectations component of the survey was surprisingly revised lower. The 1-year inflation forecast was adjusted higher to 4.7% from the preliminary estimate of 4.6%, where it was expected to remain, and down from August’s 4.8% rate. The 5-10 year inflation forecast was revised slightly lower to 2.7%, from the preliminary read of 2.8%, where it was expected to remain, and below August’s 2.9% rate.
- Personal Income rose +0.3% month-over-month in August, matching expectations and July’s upwardly revised increase. Personal Spending increased +0.4%, twice as high as expected and well ahead of the prior month’s downwardly adjusted -0.2% decline. The August Savings Rate as a percentage of disposable income was +3.5%, matching July’s downwardly revised rate.
- The preliminary August Durable Goods Orders slipped -0.2% month-over-month, better than expectations for a -0.3% decrease, but down from the prior month’s unrevised -0.1% dip. Excluding transportation, orders remained at last month’s +0.2% rise as expected. Finally, nondefense capital goods orders excluding aircraft—considered a proxy for capital spending—went up 1.3% for the month, far ahead of expectations of a +0.3% growth rate, and the prior month’s upwardly revised +0.7% rise.
- The Conference Board’s Consumer Confidence Survey, which measures American attitudes toward jobs and the economy, increased to 108.0 in September from August’s upwardly revised 103.6, beating expectations of 104.6. The Expectations Index component of business conditions for the next six months increased to 80.3 from an upwardly revised 75.8 in August. The Present Situation Index portion of the survey moved up to 149.6 from the previous month’s downwardly revised 145.3. Lynn Franco, Senior Director of Economic Indicators at The Conference Board, stated, “Consumer confidence improved in September for the second consecutive month supported in particular by jobs, wages, and declining gas prices.” She went on to say that while recession risks persisted, “Concerns about inflation dissipated further in September—prompted largely by declining prices at the gas pump—and are now at their lowest level since the start of the year.”
- The July Federal Housing Finance Agency (FHFA) House Price Index (HPI) fell -0.6% for the month in July following a tepid unrevised +0.1% advance in June. This was the first monthly decline since May 2020 and only the second since January 2017, indicating that the Fed’s aggressive tightening of monetary policy is beginning to temper the previously torrid rise in house prices. Before the June and July readings, house prices had risen +1% or more in 23 of the previous 24 months. Year-over-year the FHFA HPI was up +13.9%, which was the lowest annual rate since February 2021. The decline in house prices was widespread with prices falling in July from June in eight of the nine census divisions. The only exception is an extremely modest 0.1% m/m gain in the East North Central region.
- The S&P CoreLogic Case-Shiller National Home Price Index (HPI), which measures the average change in home prices across the nation, fell a seasonally adjusted -0.2% for the month of July, the first monthly decline in more than a decade. The 20-city composite S&P CoreLogic Case-Shiller HPI showed a +16.06% year-over-year gain, below expectations for a 17.05% gain and the prior month’s upwardly revised +18.66% increase. Home prices were down -0.44% for the month on a seasonally adjusted basis, well below expectations for a +0.20% gain and the prior month’s downwardly revised +0.19% rise.
- August New Home Sales unexpectedly surged +28.8% for the month to an annual rate of 685,000 units, far above expectations for a rate of 500,000 units and July’s upwardly revised 532,000-unit level. The Median Home Price declined -6.3% year-over-year to $436,800. New home inventory decreased to 8.1 months of supply from 10.4 in July. Sales increased month-over-month in all regions and were up year-over-year in the South and Midwest, but the North-east and West were still down. New home sales are based on contract signings, offering a timelier read on housing activity compared to the larger contributor of existing home sales, which are based on closings.
- August Pending Home Sales fell by -2.0% month-over-month, below expectations for a -1.5% decline and following July’s favorably revised -0.6% drop. Sales fell -22.5% year-over-year, better than expectations for a -24.5% drop, and about the same as July’s positively revised -22.2% fall. Pending home sales reflect contract signings and are a gauge of the pipeline of existing home sales, as properties typically go under contract a month or two before they are sold.
- The weekly MBA Mortgage Application Index fell -3.7% from the prior week’s +3.8% gain. The Refinance Index fell -10.9% from last week and the Purchase Index was down -0.9% for the week. The decrease came as the average 30-year mortgage rate rose 27 basis points to 6.52%, which is up +3.42 percentage points from last year.
- Weekly Initial Jobless Claims were 193,000 for the week ended September 24, far under expectations of 215,000, and below the prior week’s downwardly revised 209,000 (from 215,0000). Continuing Claims for the week ended September 17 fell 29,000 to 1,347,000, below expectations of 1,385,000.
The Week Ahead
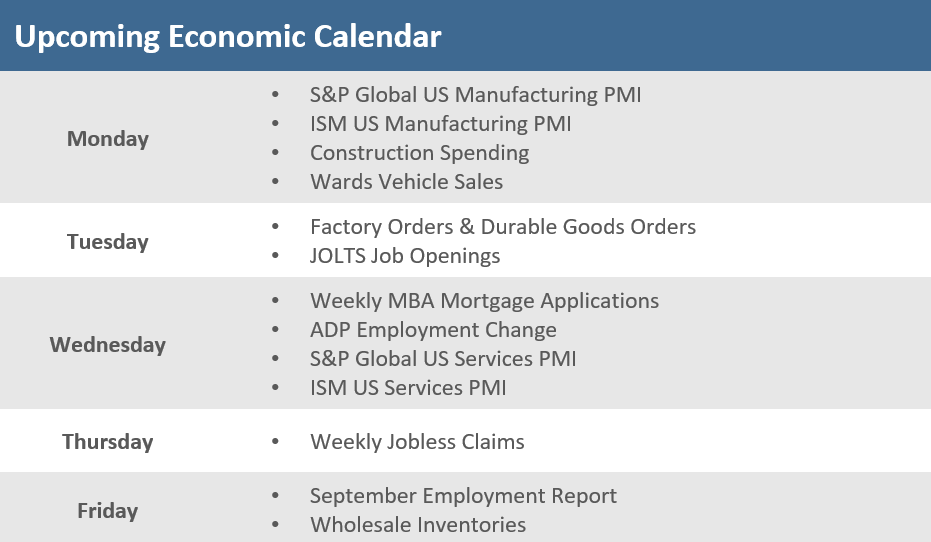
The upcoming week’s economic calendar will provide a look at purchasing managers indices (PMIs) for the U.S. manufacturing and services sectors from competing firms S&P Global and the Institute for Supply Management (ISM). There are also several releases on the labor market that will likely garner a lot of attention to see how it may play into the Fed’s policy plans. The ADP Employment Change report, the Job Openings & Labor Turnover Survey (JOLTS), weekly jobless claims, and then the highly anticipated September employment report. Other reports of note include factory orders, wholesale inventories, and consumer credit.
Did You Know?
ESTATE TAXES – The maximum amount that a deceased individual may pass onto his/her heirs federally estate tax-free (with proper planning) rose to $12.06 million in 2022, up from $11.7 million in 2021. The limit was $1 million 20 years ago in 2002. Please consult a tax expert for details (source: Internal Revenue Service, MFS).
TIMBERRR – The price of lumber futures fell to $429.30 last week, down about -33% from a year ago and more than -70% from their peak in March. Wood prices exploded in the summer of 2020 when stuck-at-home Americans remodeled en masse and suburban home sales surged. Now, lumber is leading the way down for commodities as the Federal Reserve takes aim at rising consumer prices and the overheated housing market (source: The Wall Street Journal).
FREIGHT FALLS – North American freight railroad traffic fell -2.8% for the week ended 9/24, hurt by spillover from measures taken the prior week ahead of a potential US rail strike. Carloads slipped -1.3% at 12 reporting railroads from the US, Canadian and Mexican, while the volume of intermodal units fell -4.3%. Despite the decline, analysts at Evercore ISI said closely watched service metrics for US rails continue to trend favorably. North American rail traffic is down -2.4% for the first 38 weeks of the year (source: Association of American Railroads, The Wall Street Journal).
This Week in History
NOT QUITE ROCKET SPEED – On September 27, 1820, a train carried passengers for the first time as George Stephenson, a self-taught engineer in the coal mines of Newcastle, England, demonstrated his new steam-propelled locomotive on rails, “The Rocket.” The train hauled a huge cargo load from Brusselton to Stockton—a total of just under 21 miles—in four hours and 12 minutes, at a blistering pace of 5 mph (source: The Wall Street Journal).
Asset Class Performance
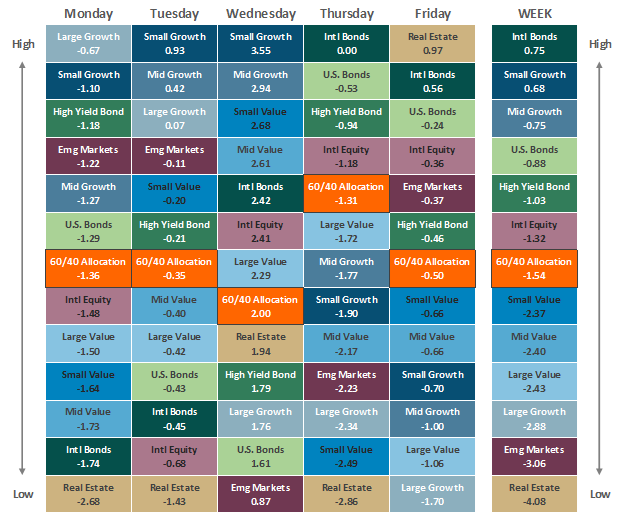
The Importance of Diversification. Diversification mitigates the risk of relying on any single investment and offers a host of long-term benefits, such as lowering portfolio volatility, improving risk-adjusted returns, and helping investments to compound more effectively.
Source: Bloomberg.
Asset‐class performance is presented by using market returns from an exchange‐traded fund (ETF) proxy that best represents its respective broad asset class. Returns shown are net of fund fees for and do not necessarily represent performance of specific mutual funds and/or exchange-traded funds recommended by The Retirement Planning Group. The performance of those funds may be substantially different than the performance of the broad asset classes and to proxy ETFs represented here. U.S. Bonds (iShares Core U.S. Aggregate Bond ETF); High‐Yield Bond (iShares iBoxx $ High Yield Corporate Bond ETF); Intl Bonds (SPDR® Bloomberg Barclays International Corporate Bond ETF); Large Growth (iShares Russell 1000 Growth ETF); Large Value (iShares Russell 1000 Value ETF); Mid Growth (iShares Russell Mid-Cap Growth ETF); Mid Value (iShares Russell Mid-Cap Value ETF); Small Growth (iShares Russell 2000 Growth ETF); Small Value (iShares Russell 2000 Value ETF); Intl Equity (iShares MSCI EAFE ETF); Emg Markets (iShares MSCI Emerging Markets ETF); and Real Estate (iShares U.S. Real Estate ETF). The return displayed as “Allocation” is a weighted average of the ETF proxies shown as represented by: 30% U.S. Bonds, 5% International Bonds, 5% High Yield Bonds, 10% Large Growth, 10% Large Value, 4% Mid Growth, 4% Mid Value, 2% Small Growth, 2% Small Value, 18% International Stock, 7% Emerging Markets, 3% Real Estate.
* The term basis points (bps) refers to a common unit of measure for interest rates and other percentages in finance. One basis point is equal to 0.01%. Bond prices and bond yields are inversely related. As the price of a bond goes up, the yield decreases.


