Quick Takes
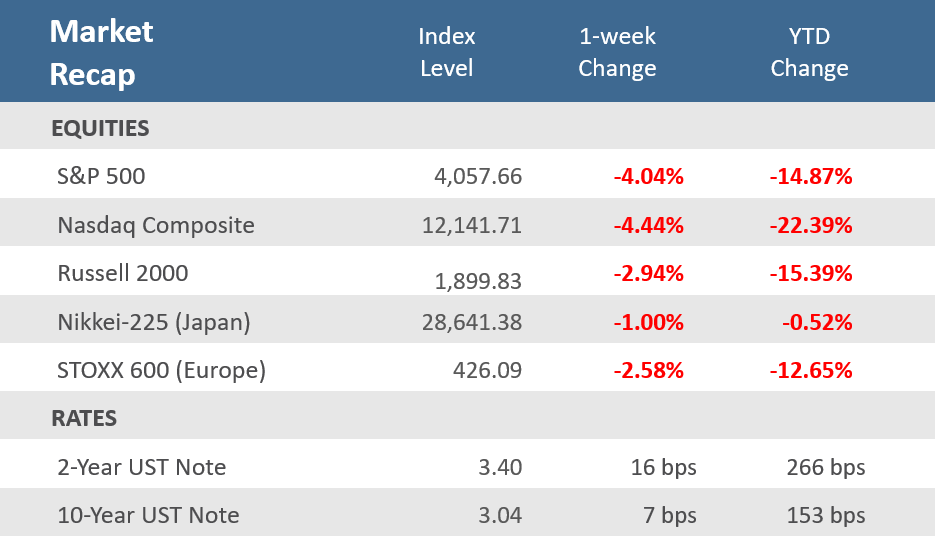
- For the week the S&P 500 was down -4.0%, the Nasdaq sank -4.4%, and the Russell 2000 fell -2.9% in the second straight week of weighty declines for stocks. Aggressive comments from Federal Reserve Chairman Jerome Powell on Friday at the annual Jackson Hole Economic Policy Symposium were the primary catalyst for pulling stocks down.
- Treasuries were mixed as the yield on the 2-year and 10-year U.S. Treasury notes fell 1 basis point to 3.40% and 3.04% respectively. As a result, the spread between the 2-year and 10-year Treasury yields widened and the yield curve remained inverted. The Bloomberg U.S. Aggregate Bond Index fell -0.4% for the week.
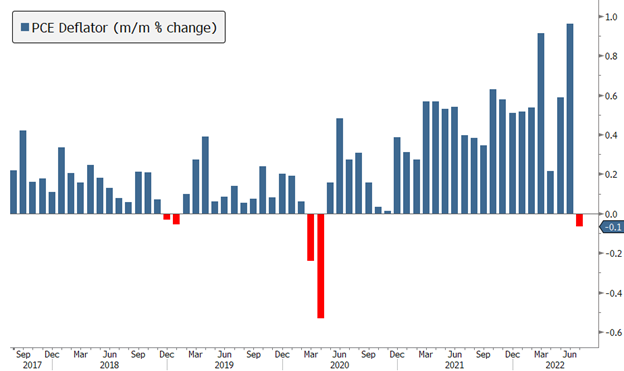
- More signs of peak inflation were reported as an inflation gauge that is heavily watched by the Fed, the Personal Consumption Expenditures (PCE) Deflator, fell more than expected in July and was the first month-over-month decline for the index since the early days of the pandemic in April 2020.
Stocks down solidly, marking second straight weekly decline
Last week equities started with a dud and ended with a thud, plunging in Friday’s session as Federal Reserve Chairman Jerome Powell gave a brief and frank talk at the Jackson Hole Economic Policy Symposium that the Fed will continue to raise interest rates until the data tells them otherwise. The S&P 500 fell for a second consecutive week, as the markets digested whether the Fed’s aggressive stance will push the U.S. economy into a recession. For the week the S&P 500 was down -4.0%, while the Nasdaq fell -4.4%. Small cap stocks fared a little better, but the Russell 2000 was still down -2.9%. During his Jackson Hole message, Powell said that the Fed will continue raising interest rates and hold them at a higher level until it is confident inflation is under control. “Restoring price stability will likely require maintaining a restrictive policy stance for some time. The historical record cautions strongly against prematurely loosening policy,” he warned. Looking ahead, Powell said the June Fed Open Market Committee (FOMC) projections suggest rates would rise to just below 4% through the end of 2023. Powell’s resolutely hawkish comments sent the S&P 500 down -3.4% on Friday, wiping out a modest, and low volume, rebound from Monday’s -2.1% pullback.
The Treasury market, which had already been under pressure with prospects of a more hawkish Fed, held its ground better than stocks did in the wake of Mr. Powell’s speech. The 2-yr note yield rose just one basis point to 3.40% on Friday and the 10-yr note also rose just one basis point to 3.04%. For the week they were up 16 basis points and 7 basis points, respectively. So, the yield curve remains inverted and flattened over the week. As August began, the 2-yr Treasury note yield was just 2.90% and the 10-yr Treasury note yield was at 2.64%. As a result, the Bloomberg U.S. Aggregate Bond Index slipped -0.4% for the week, holding up much better than stocks.
Economic data was mixed, with August preliminary reports on manufacturing and services PMIs continuing to slow, and both new home sales and pending home sales falling. On the other hand, preliminary durable goods orders were mostly better than anticipated, and initial jobless claims unexpectedly moderated. Inflation data, which has been the primary catalyst for the Fed’s aggressive monetary policy stance, continued to signal that peak inflation may be behind us. A closely watched Fed inflation gauge—the PCE Deflator—decelerated more than expected, and the University of Michigan Consumer Sentiment report showed that consumer expectations for both short-term and long-term inflation decreased more than expected.
With earnings season just about over and the Fed taking a much more hawkish outlook, the markets will be focused on the balance between inflationary pressures and recessionary risks as Fed officials make the rounds on speaking engagements and influential data reports like next Friday’s August nonfarm payrolls and employment report are released.
Chart of the Week
An inflation gauge that is heavily watched by the Fed, the Personal Consumption Expenditures (PCE) Deflator, fell more than expected in July, slipping -0.1% for the month, versus expectations to remain flat and down from June’s unadjusted +1.0% rise. That was the first month-over-month decline for the index since the early days of the pandemic in April 2020. Excluding food and energy, the Core PCE Price Index rose +0.1% for the month, below expectations for +0.2% and June’s unadjusted +0.6% gain.
Year-over-year, the headline PCE Deflator was +6.3% higher, below expectations for +6.4%, and the prior month’s unadjusted +6.8% rise. The Core PCE Price Index, again excluding food and energy, was up +4.6% for the year, just shy of expectations for +4.7% and June’s unrevised +4.8% rise. It’s declined steadily since the peak of +5.3% in February but remains more than twice as high as the Fed’s +2% target. So PCE inflation may have peaked, but for now, it only means its annual rate is lower, not necessarily low.
Peak PCE inflation? PCE Deflator falls for the first time since April 2020
Monthly change in U.S. Personal Consumption Expenditures (PCE) Price Index
Economic Review
- The second estimate (of three) of Q2 Gross Domestic Product (GDP), the broadest measure of U.S. economic output, was revised up slightly to a -0.6% quarter-over-quarter annualized rate of contraction, up from the initial estimate of a -0.9% contraction and above expectations for a -0.7% decline. Personal Consumption Expenditures (PCE) were up +1.5%, in line with expectations, and above than the prior reading of +1.0%–boosting its contribution to overall GDP to 1.0%-point from 0.7%-point in the advance report. Regarding inflation, the GDP Price Index rose +8.9%, above expectations for it to remain at +8.7%, marking the highest level in over 40 years. The Core PCE Price Index, which excludes food and energy, was at a +4.4% growth rate, matching expectations, and the prior reading.
- July Personal Income rose +0.2% for the month, below expectation for +0.6% and June’s upwardly revised +0.7% gain. Personal Spending increased +0.1%, below expectations for +0.5%, and the prior month’s downwardly revised +1.0% gain. The July Savings Rate as a percentage of disposable income was 5.0%, matching June’s downwardly revised rate.
- The final August University of Michigan Consumer Sentiment Index release was revised much higher than the expected 55.5, rising to 58.2 from the preliminary 55.1. The upward revision came as both the Current Conditions and the Expectations components of the survey were revised solidly higher from the preliminary estimate. The overall index continued to come off June’s record low of 50.0 as current conditions improved but expectations made a noticeable monthly rise. The 1-year inflation forecast was revised lower to 4.8% from the preliminary estimate of 5.0%, where it was expected to remain, and down from July’s 5.2% rate. The 5-10 year inflation forecast was revised slightly lower to 2.9%, from the preliminary read of 3.0%, where it was expected to remain, and matching July’s rate.
- Led by improvements in production-related indicators, the Chicago Fed National Activity Index (CFNAI) rose to +0.27 in July from -0.25 in June. All four broad categories of indicators used to construct the index made positive contributions in July, and all four categories improved from June. The index is a weighted average of 85 indicators of growth in national economic activity. Fifty-five indicators improved from June to July, while 30 indicators deteriorated.
- The preliminary S&P Global U.S. Manufacturing PMI Index for August declined to 51.3 from an unrevised 52.2 in July, below expectations of a decline to 51.8. The preliminary S&P Global U.S. Services PMI Index unexpectedly fell to 44.1, far below expectations of a rise to 49.8 from 47.7 in July. Despite the declines, the manufacturing PMI remains in expansion territory, while the services PMI stays in contraction territory, with 50 being the demarcation point between the two zones.
- July preliminary Durable Goods Orders were flat for the month, below expectations for a +0.8% increase and well under June’s upwardly revised 2.2% increase (from 1.9%). New orders for nondefense capital goods excluding aircraft, a key measure of capital goods spending, rose +0.4% (+8.5% y/y) in July after a +0.9% rise in June.
- The August Richmond Fed Manufacturing Activity Index fell more than expected into contraction territory (a reading below zero), dropping to -8 from 0 in July, and well below expectations of -2. Shipments and vendor lead time fell into negative territory, while new order volumes and a backlog of orders accelerated further into negative territory. Service expenditures moved into expansion territory, and actual capital expenditures accelerated and remained expansionary.
• The August Kansas City Fed Manufacturing Activity Index sank much more than expected. Still, it remained in expansion territory (a reading above zero), coming in at 3 from July’s unrevised 13, far below expectations for a decline to 10. July’s reading was the lowest since July 2020, with shipments, production, and new orders all in negative territory.
• July New Home Sales sank -12.6% in the month to an annual rate of 511,000 units, far below expectations of 575,000 units, and below June’s unrevised 590,000 units. The median home price rose +8.2% year-over-year to $439,400. New home inventory increased to 10.9 months from June’s level of a 9.2 months of supply at the current sales pace. Sales increased for the month in the Northeast but declined in the South, Midwest, and West. Sales were lower for the trailing year in all regions. - July Pending Home Sales fell less than expected, down -1.0% for the month, better than expectations for a -2.6% decline and June’s downwardly revised -8.6% drop. Sales tumbled -22.5% year-over-year, worse than the expected -21.4% drop, and June’s downwardly revised -20.1% fall. Pending home sales reflect contract signings and are a gauge of the pipeline of existing home sales, as properties typically go under contract a month or two before they are sold.
- The weekly MBA Mortgage Application Index declined -1.2% following the prior week’s -2.3% decline. The Refinance Index fell -2.8% from last week and the Purchase Index was down -0.5% for the week. The decline came as the average 30-year mortgage rate rose 20 basis points to 5.65% and is up +262bps from last year.
- Weekly Initial Jobless Claims were 243,000 for the week ended August 20, under expectations of 252,000, and down from the prior week’s downwardly revised 245,000. Continuing Claims for the week ended August 13 declined 19,000 to 1,415,000, below expectations of 1,441,000.
The Week Ahead
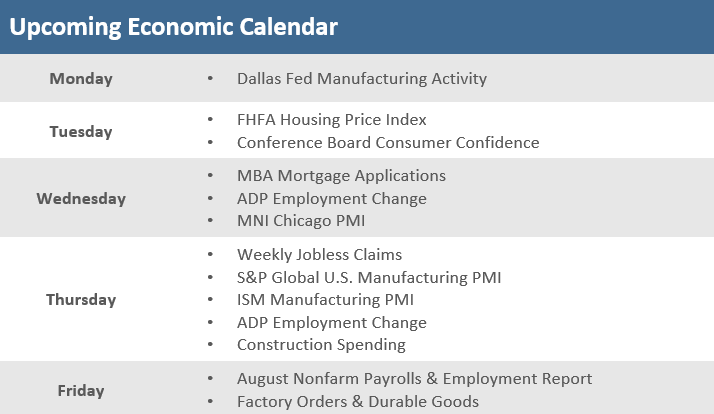
Next week the economic calendar will likely be magnified by last week’s news from the Federal Reserve’s annual Jackson Hole Symposium in which the Fed said they will be more aggressive with the monetary policy until the data tells them otherwise, plus Fed Vice Chair Lael Brainard speaks on Monday. The upcoming week’s economic reports include the August Consumer Confidence Index and September manufacturing Purchasing Managers Indices (PMIs) from competing firms S&P Global and the Institute for Supply Management (ISM). The labor market will play a big role in the economic landscape this week with the ADP Employment Change report and the Job Openings and Labor Turnover Survey (JOLTS). Still, perhaps the headlining event for the week will be the key August Nonfarm Payroll and Employment Report.
Did You Know?
NEXT FED ACTION – As of Friday 8/19/2022 at noon ET, the bond market was priced to reflect a 54.5% chance that the Fed will raise short-term interest rates by 0.50 percentage points on 9/21/2022, and a 45.5% chance that the Fed will raise short-term interest rates by 0.75 percentage points on 9/21/2022 (source: CME Group, BTN Research).
RELIABLE INDICATOR – The U.S. economy contracted by -0.9% in the 2nd quarter of 2022 (i.e., quarter-over-quarter performance expressed as an annualized result) on the heels of a -1.6% contraction in the 1st quarter of 2022. That’s the 8th time the United States has suffered 2 or more consecutive down quarters since 1960, meeting one often-used definition of a recession. Officially, the United States has experienced 9 recessions since 1960 (source: National Bureau of Economic Research, BTN Research).
WASN’T ALWAYS THIS GOOD – The average home price in the United States increased +8.1% per year for the 10 years ending 5/31/2022 but that included an +18.3% increase in price for the 1-year ending 5/31/2022. In the previous decade, American home prices increased just +1.4% per year for the 10 years ending 5/31/2012 (Source: Federal Housing Finance Agency, BTN Research).
This Week in History
BLUE CROSS BEGINNINGS – On August 25, 1872, Justin Ford Kimball was born near Huntsville, Texas. In 1929, as an administrator at Baylor University’s hospital, he noted that Baylor was treating many Dallas teachers who couldn’t pay their hospitalization costs. So he created a plan enabling teachers to prepay 50 cents a month for up to 21 days of treatment at Baylor. By the end of 1929, as the Great Depression set in, three-fourths of all teachers in Dallas had signed up, and Kimball’s Blue Cross health insurance soon went nationwide (source: The Wall Street Journal).
Asset Class Performance
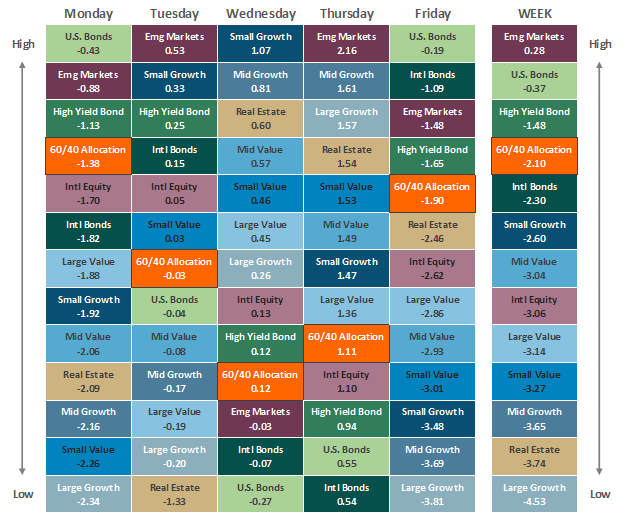
The Importance of Diversification. Diversification mitigates the risk of relying on any single investment and offers a host of long-term benefits, such as lowering portfolio volatility, improving risk-adjusted returns, and helping investments to compound more effectively.
Source: Bloomberg. Asset‐class performance is presented by using market returns from an exchange‐traded fund (ETF) proxy that best represents its respective broad asset class. Returns shown are net of fund fees for and do not necessarily represent the performance of specific mutual funds and/or exchange-traded funds recommended by The Retirement Planning Group. The performance of those funds may be substantially different than the performance of the broad asset classes and to proxy ETFs represented here. U.S. Bonds (iShares Core U.S. Aggregate Bond ETF); High‐Yield Bond (iShares iBoxx $ High Yield Corporate Bond ETF); Intl Bonds (SPDR® Bloomberg Barclays International Corporate Bond ETF); Large Growth (iShares Russell 1000 Growth ETF); Large Value (iShares Russell 1000 Value ETF); Mid Growth (iShares Russell Mid-Cap Growth ETF); Mid Value (iShares Russell Mid-Cap Value ETF); Small Growth (iShares Russell 2000 Growth ETF); Small Value (iShares Russell 2000 Value ETF); Intl Equity (iShares MSCI EAFE ETF); Emg Markets (iShares MSCI Emerging Markets ETF); and Real Estate (iShares U.S. Real Estate ETF). The return displayed as “Allocation” is a weighted average of the ETF proxies shown as represented by: 30% U.S. Bonds, 5% International Bonds, 5% High Yield Bonds, 10% Large Growth, 10% Large Value, 4% Mid Growth, 4% Mid Value, 2% Small Growth, 2% Small Value, 18% International Stock, 7% Emerging Markets, 3% Real Estate.
Chris Bouffard is CIO of The Retirement Planning Group (TRPG), a Registered Investment Adviser. He has oversight of investments for the advisory services offered through TRPG.
Disclaimer: Information provided is for educational purposes only and does not constitute investment, legal or tax advice. All examples are hypothetical and for illustrative purposes only. Past performance of any market results is no assurance of future performance. The information contained herein has been obtained from sources deemed reliable but is not guaranteed. Please contact TRPG for more complete information based on your personal circumstances and to obtain personal individual investment advice.


