Quick Takes
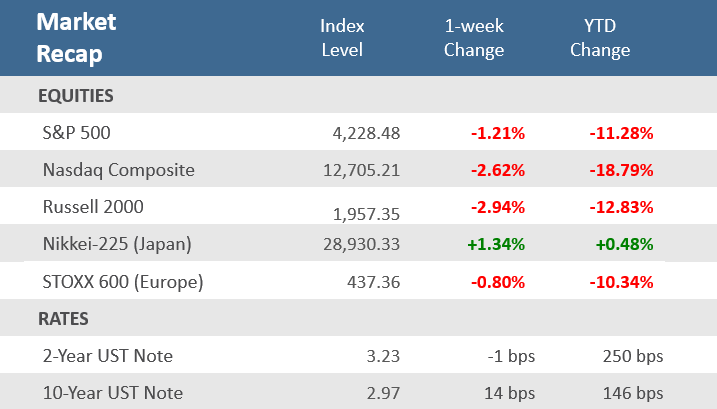
- For the week, the S&P 500 fell -1.2%, the Nasdaq was down -2.2%, and the Russell 2000 sank -2.9%, snapping a four-week winning streak for stocks. Rising bond yields and aggressive comments from a trio of regional Federal Reserve presidents had equity investors pushing pause on a sharp rally since the mid-June lows.
- Treasuries were mixed as the yield on the 2-year U.S. Treasury note fell 1 basis point to 3.23%, while the yield on the 10-year Treasury rose +14 basis points to 2.97%. As a result, the spread between the 2-year and 10-year Treasury yields narrowed considerably, though it is still inverted. The Bloomberg U.S. Aggregate Bond Index fell -0.9% for the week.
- Rising mortgage rates, higher home prices, and a shortage of homes for sale are cooling the once red-hot housing market. Homebuilder sentiment sank in August while existing home sales, housing starts, building permits, and mortgage applications all fell for their respective recent periods.
Stocks run out of gas, end four-week winning streak
A broad-based decline Friday put away any hope for stocks to continue their four-week winning streak and halted, for now, a sharp rally from the June 16 lows. For the week, the S&P 500 fell -1.2%, the Nasdaq was down -2.2%, and the Russell 2000 sank -2.9%. Even with the week’s losses, the S&P 500 index has climbed +15% from the mid-June lows and the extreme pessimism following the worst first half of a year in decades seems to have faded. The Russia-Ukraine war, the highest inflation in decades, and two-quarters of negative economic growth aren’t weighing on the market nearly as much as they had been. A solid July employment report and improving inflation data—particularly a pullback in gas and commodity prices—have helped fuel a rebound in investor sentiment. Additionally, better-than-expected second-quarter earnings results and a drop in bond yields have added support for stocks. On Wednesday, the Commerce Department reported that after stripping out gasoline and auto sales, July retail spending rose more than expected, showing shoppers maintained their ability to consume. Moderation in the recent week’s jobless claims and an unexpected jump back into expansion territory for Philadelphia manufacturing were other positives. All these factors have helped fuel the rally, particularly the riskier and more speculative pockets of the market.
However, Friday’s setback showed that we’re not out of the woods yet. Minutes from the Federal Reserve’s July Open Market Committee meeting and comments from a trio of regional Fed presidents signaled that the Fed would likely continue hiking rates in the near term. New York manufacturing fell sharply and unexpectedly dropped into contraction territory, in contrast to the Philadelphia manufacturing results. As discussed in the Chart of the Week below, housing and construction activity has slowed considerably more than expected, and the Conference Board Leading Economic Indicators (LEIs) fell for a fifth-straight month. The risk of still-high inflation combined with deteriorating economic activity and rising unemployment will challenge the Fed in the months ahead as they’ll have to wage their fight against inflation with consideration to a potentially faltering economy. For investors, there’s data for both bulls and bears to make their case, which has the potential to revive volatility after it had subsided significantly since spiking in June. The Cboe VIX Volatility Index was as high as 34 on June 13 and gradually fell to under 20 from August 12 through August 18, before popping to 20.6 on Friday, August 19.
Chart of the Week
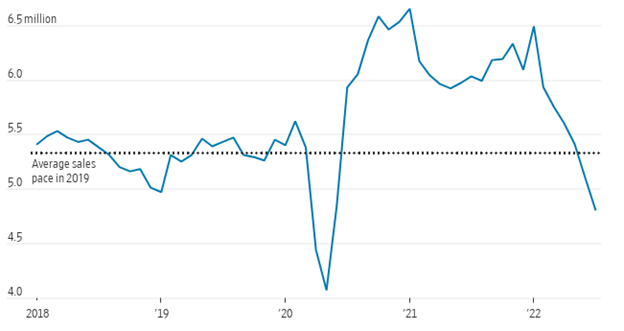
Rising U.S. interest rates are pressuring the housing market. Homebuilder sentiment sank in August as the National Association of Home Builders (NAHB) Housing Market Index dropped for the eighth straight month and fell into contraction territory for the first time since May 2020. The NAHB said, “Tighter monetary policy from the Federal Reserve and persistently elevated construction costs have brought on a housing recession,” adding that “Ongoing growth in construction costs and high mortgage rates continue to weaken market sentiment for single-family home builders.” Meanwhile, sales of existing homes fell for a sixth straight month in July, down nearly -6% from June and down -20% from the prior year. That’s the longest streak of declines in more than eight years and it was the weakest pace of unit sales since November 2015, excluding the three-month pandemic-related drop in the spring of 2020. As shown in the chart below, sales of existing homes are now below the average pace of 2019. According to Bloomberg, the nearly -26% decline in previously owned home sales since January of 2022 marks the steepest six-month plunge since 1999 and underscores a housing market that’s reeling from elevated mortgage rates and prices. Home-building is also drying up, and mortgage applications are falling as more buyers stay on the sidelines. “We are in a housing recession,” said Lawrence Yun, chief economist for the National Association of Realtors.
“Housing Recession”
U.S. Existing Home Sales
Source: National Association of Realtors, The Wall Street Journal
Economic Review
- The July Conference Board Leading Economic Index (LEI) fell -0.4% for the month, slightly less than the expected -0.5% decline, and better than June’s upwardly revised -0.7% drop. The index recorded its fifth negative reading in a row as jobless claims, ISM new orders, building permits, and average consumer expectations were the biggest detractors, more than offsetting gains in the average workweek, credit conditions, interest rate spread, and lesser increases in other categories.
- The advance release of Retail Sales for July was flat, under expectations for a +0.1% rise, and below June’s downwardly revised +0.8% increase. Sales ex-autos rose +0.4%, above expectations for a -0.1% dip and below June’s downwardly revised +0.9% rise. Importantly, sales ex-autos and gas rose +0.7%, nearly twice expectations of +0.4%, and matching June’s unadjusted gain. The control group, a figure used to calculate GDP, increased +0.8%, above the expectation of a +0.6%, and June’s downwardly revised +0.7%. Data showed that department store sales growth, already negative, contracted slightly as stores started lowering prices to meet slowing consumer demand. Building materials and electronics sales both rose, while sales of apparel, gas, motor vehicles, as well as food and drink services, fell.
- The minutes for the July Federal Reserve Federal Open Market Committee (FOMC) meeting, in which the target for the benchmark interest rate was raised by 75 basis points (bps) to a range of 2.25% to 2.50%. In the release, the Fed said that moving to a restrictive stance and raising rates would be appropriate because of high inflation but did emphasize that its decisions would be data-dependent. The participants of the meeting discussed their concerns about the risk of tightening monetary policy more than necessary in response to the constantly changing nature of the economic environment. When discussing the appropriate policy stance, participants remarked that the labor market was very tight and that inflation was far above the objective, but falling commodity prices that the markets took as a sign of peak inflation should not be relied on as the prices could quickly rebound. Participants judged that as the stance of monetary policy tightened further, it would likely become appropriate at some point to slow the pace of rate increases.
- July Industrial Production increased +0.6%, beating expectations of +0.3%, and matching June’s upwardly revised reading. It was the first increase in three months, led by a +6.6% monthly rise in motor vehicles as semiconductor bottlenecks eased. Growth in motor vehicle output helped to offset declines in home electronics, appliances, and furniture. Capacity Utilization rose to 80.3% from the prior month’s downwardly revised 79.9%, above expectations of 80.2%.
- The August Empire Manufacturing Index, a measure of factory activity in the New York region, showed the index unexpectedly dropped into a level depicting contraction (a reading below zero). The index fell to -31.0 from 11.1 in July and was expected to decline to 5.0. New orders dropped soundly into negative territory and inventory growth slowed. Employment fell but remained in expansion territory and prices paid slowed but remained at expansion levels.
- The August Philly Fed Manufacturing Business Outlook Index unexpectedly rose above expansion territory (a reading above zero), advancing to 6.2 versus expectations for a rise to -5.0 from -12.3 in July. New orders improved solidly but remained in contraction territory, and shipments grew at a much faster pace, while employment growth accelerated, and prices paid decelerated but remained elevated.
- July Housing Starts fell -9.6% for the month to an annual pace of 1,446,000 units, well below expectations for a decline to 1,527,000 units and below June’s upwardly revised 1,599,000 units. Building Permits, one of the leading indicators tracked by the Conference Board as it is a gauge of future construction, decreased by -1.3% for the month to an annual rate of 1,674,000, beating expectations of 1,640,000 units, but below the upwardly revised 1,696,000 units in June.
- Homebuilder sentiment sank in August as the National Association of Home Builders (NAHB) Housing Market Index (HMI) dropped for the eighth straight month to 49 from July’s unrevised 55, which was below expectations for a decline to 54. Readings below 50 suggest poor conditions and it is the first time homebuilder sentiment was below 50 since May 2020.
- July Existing Home Sales fell -5.9% for the month, worse than expectations for a -5.1% drop, to an annual rate of 4.81 million units, versus expectations for 4.86 million units. June’s figure was downwardly revised to 5.11 million units. Contract closings fell for the sixth-straight month to its lowest level since May 2020, as sales all over the country were lower. Northeastern and Midwestern sales were down more than last month’s figures, while sales in the South and West declined less than in June but were still negative. The median existing-home price was up +10.8% from a year ago to $403,800, but slightly lower than last month’s countrywide average price of $420,900. The number of homes for sale rose slightly from last month, and at the current sales pace, it would take 3.3 months to sell all the houses on the market, which marks the sixth-straight monthly rise. Existing home sales account for a large majority of the home sales market and reflect contract closings instead of signings.
- The weekly MBA Mortgage Application Index declined -2.3% following the prior week’s +0.2% rise, snapping a two-week streak. The Refinance Index fell -5.4% from last week and the Purchase Index was up -0.8% for the week. The decline came despite the average 30-year mortgage rate falling 2 basis points to 5.45% but is still up +239bps from last year.
- Weekly Initial Jobless Claims were 250,000 for the week ended August 13, better than expectations of 264,000, and down from the prior week’s downwardly revised 252,000. Continuing Claims for the week ended July 30 increased 13,250 to 1,413,000, above expectations of 1,455,000.
The Week Ahead
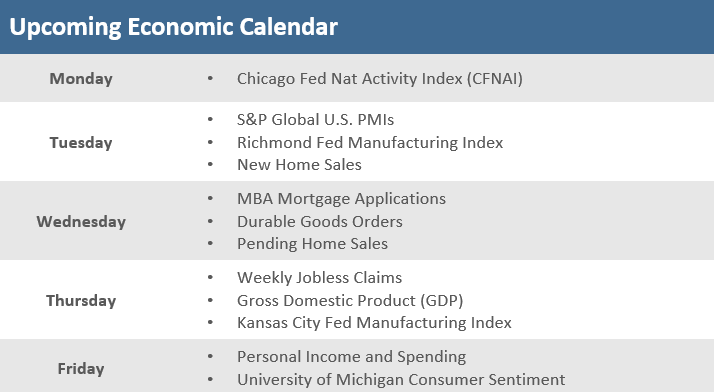
Economic data out next week include the S&P Global’s Purchasing Managers’ Indexes (PMIs) for August, new and pending home sales, durable goods, July consumer spending, and the Fed’s preferred inflation gauge (Core PCE) for July. A big focus will be the Kansas City Fed’s Jackson Hole annual symposium which runs from Thursday to Saturday. Fed leaders often use the gathering to announce policy shifts, clarify their thinking and expand on their outlook for the economy. Fed Chairman Jerome Powell is scheduled to speak Friday at 10 a.m. ET.
Did You Know?
HOT SUMMER – The S&P 500 is up +12% in July and August through Friday, August 19. If held, this would go down as one of the best summer rallies ever. The last three times it gained more than +10% in July and August was 1989 (+11.2%), 2009 (+11.4%), and 2020 (+13.2%). What happened in the final four months of those three years? The S&P 500 added an additional 1.6%, 11.1%, and 7.9%, respectively. It is probably safe to say that even with a big rally in the final days of August 2022 that a new July and August record won’t be set – in 1932 the market rallied +89% over July and August (source: Carson, Ycharts, Bloomberg).
AFFORDABILITY DROPS – U.S. housing affordability is at its lowest level in 33 years, below the July 2006 low which was at the peak of the last housing bubble. Back then, national home prices subsequently fell -25% to their low in December 2011. Two years ago, the 30-year mortgage rate was 2.96% and the median existing-home price in the US was $306,000. Today the 30-year mortgage rate is 5.60% and the median existing-home price is $404,000. With a 20% down payment, that’s an +81% increase in the monthly payment—from $1,026 to $1,855 (source: Compound Capital).
STILL GROWING – With inflation hitting a 40-year high, and despite projections that it would begin to shrink its balance sheet in 2022, so far this year the U.S. Federal Reserve has increased their balance sheet by another +1.1%. This follows a +19% increase in 2021 and an unprecedented +77% increase in 2020 in response to the COVID-19 pandemic. Total Fed balance sheet assets currently stand at $8.85 Trillion, up from $732 Billion in 2002, an +1,109% increase (source: Compound Capital).
This Week in History
GOOGLE IT – On August 19, 2004, in the most eagerly anticipated initial public offering in years, Google’s stock began trading. The company conducted a rare “Dutch auction” in which bidders (including individual investors) competed to create the price at which all shares could be sold. Initially priced at $85, the stock opened for trading at $100 a share and closed at $100.335 on the volume of 22.4 million shares. Although most investment bankers jeered, the IPO was a success. (source: The Wall Street Journal).
Asset Class Performance
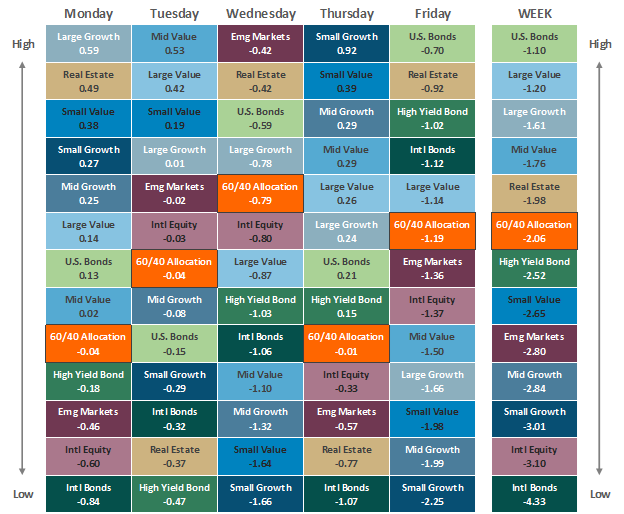
The Importance of Diversification. Diversification mitigates the risk of relying on any single investment and offers a host of long-term benefits, such as lowering portfolio volatility, improving risk-adjusted returns, and helping investments to compound more effectively.
Source: Bloomberg. Asset‐class performance is presented by using market returns from an exchange‐traded fund (ETF) proxy that best represents its respective broad asset class. Returns shown are net of fund fees for and do not necessarily represent the performance of specific mutual funds and/or exchange-traded funds recommended by The Retirement Planning Group. The performance of those funds may be substantially different than the performance of the broad asset classes and to proxy ETFs represented here. U.S. Bonds (iShares Core U.S. Aggregate Bond ETF); High‐Yield Bond (iShares iBoxx $ High Yield Corporate Bond ETF); Intl Bonds (SPDR® Bloomberg Barclays International Corporate Bond ETF); Large Growth (iShares Russell 1000 Growth ETF); Large Value (iShares Russell 1000 Value ETF); Mid Growth (iShares Russell Mid-Cap Growth ETF); Mid Value (iShares Russell Mid-Cap Value ETF); Small Growth (iShares Russell 2000 Growth ETF); Small Value (iShares Russell 2000 Value ETF); Intl Equity (iShares MSCI EAFE ETF); Emg Markets (iShares MSCI Emerging Markets ETF); and Real Estate (iShares U.S. Real Estate ETF). The return displayed as “Allocation” is a weighted average of the ETF proxies shown as represented by: 30% U.S. Bonds, 5% International Bonds, 5% High Yield Bonds, 10% Large Growth, 10% Large Value, 4% Mid Growth, 4% Mid Value, 2% Small Growth, 2% Small Value, 18% International Stock, 7% Emerging Markets, 3% Real Estate.
Chris Bouffard is CIO of The Retirement Planning Group (TRPG), a Registered Investment Adviser. He has oversight of investments for the advisory services offered through TRPG.
Disclaimer: Information provided is for educational purposes only and does not constitute investment, legal or tax advice. All examples are hypothetical and for illustrative purposes only. Past performance of any market results is no assurance of future performance. The information contained herein has been obtained from sources deemed reliable but is not guaranteed. Please contact TRPG for more complete information based on your personal circumstances and to obtain personal individual investment advice.


