Quick Takes
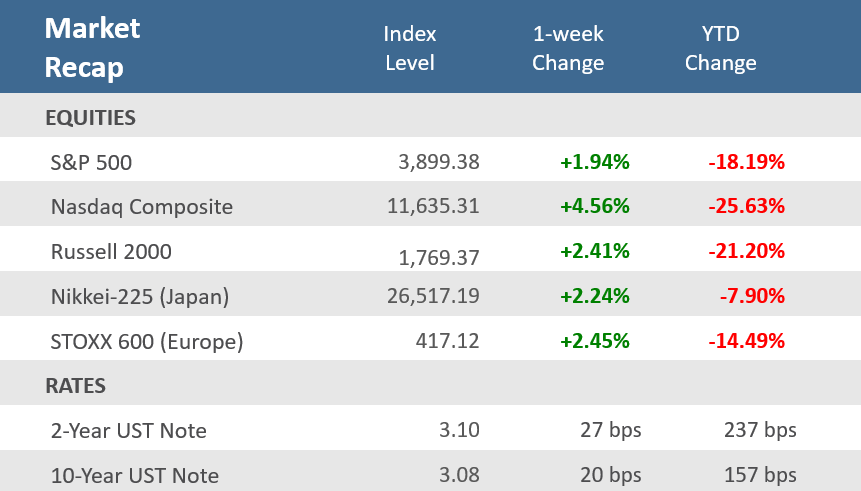
- Stocks advanced for the second week in the last three, but inflation and recession concerns remain top concerns. The S&P 500 was up +1.9% for the week, advancing for four of the five days, and the tech-heavy Nasdaq was up five straight days for a +4.6% gain on the week.
- Bond yields jumped higher after the Fed’s June policy meeting minutes reiterated the Fed’s aggressive stance in battling inflation, as well as a stronger-than-expected June jobs report. The yield on the 10-year Treasury was up 20 basis points (bps) and the 2-year was up 27 bps.
- June nonfarm payrolls rose by 372,000, far more than expectations of a 265,000 rise. The unemployment rate remained at 3.6% for the fourth straight month, which is just a hair above the 50-year low of 3.5% reached before the pandemic hit in early 2020.
Markets rebound for a second week higher in the last three.
U.S. stocks showed were able to advance this week in the face of lingering concerns over inflation and recession. All major U.S. equity indices posted their second weekly gain in the last three, shrugging off tighter financial conditions as Treasury yields bounced higher and the U.S. dollar continued its ascent. Treasury yields spiked on Wednesday’s release of the minutes from the Fed’s June monetary policy meeting, in which the Committee stressed the need to stay vigilant against inflation even at the risk of spurring a recession, and then yields popped again on Friday’s better-than-expected June employment report in which the economy added 372,000 jobs, about 120,000 more than expected. The S&P 500 was up +1.9% for the week, advancing for four of the five days. The Russell 2000 small cap index was up +2.4%. But the big winner was the tech-heavy Nasdaq, which was up five straight days for the first time this year and gained +4.6% for the week.
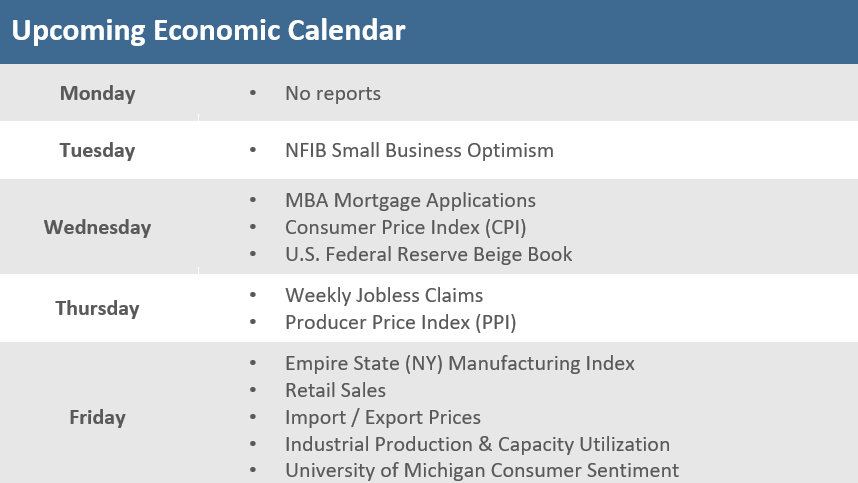
Recession fears have become a key factor on Wall Street, but the jobs data shows that the economic downturn is not here just yet. Jobs were strong across the board, with health care, professional services, and leisure and hospitality among the top sectors last month. The government was the only sector that lost workers. Wall Street strategists believe that the report is good news for the economy but may also give the Federal Reserve the confidence to keep being aggressive with its rate hikes. However, a recent decline in commodities prices might indicate inflation may be peaking and make a so-called “soft landing” for the U.S. economy more probable, boosting stocks. Still, many investors believe that the Federal Reserve will stick to its aggressive stance against inflation, boosting the prospect of another 75 bps Fed hike in July. As a result, the Bloomberg Aggregate Bond Index slipped -0.9% for the week. The inflation picture will remain a key focus as the Consumer Price Index (CPI), Producer Price Index (PPI), and the Import Price Index all report in the upcoming week.
Chart of the Week
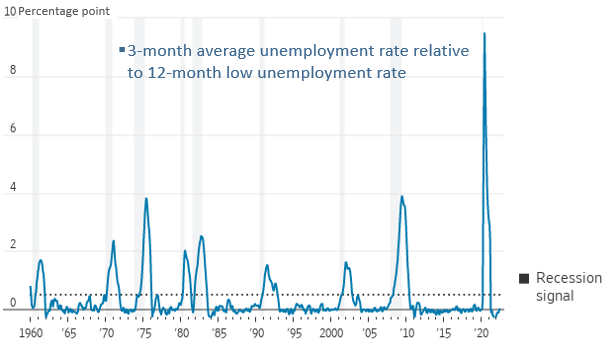
As we head into the second half of 2022, inflation remains front and center for consumers and policymakers, and financial markets are trying to determine whether the U.S. is amid an economic slowdown, already in a recession, or facing a potential recession. Gross Domestic Product (GDP) data and forecasts suggest that we are in an economic slowdown, with overall economic output contracting for two straight quarters. That’s not the official definition of recession, which is determined by the National Bureau of Economic Research (NBER) – usually months after the fact – but is still an industry recognized rule-of-thumb. However, the labor market is not confirming the GDP recession warning. Another prevalent recession indicator with a history of accuracy says we are not yet in recession and given the strength of Friday’s employment report we’re still quite a distance from levels of past recessions. The Sahm Rule, put forth by economist Claudia Sahm, says that if the average of the unemployment rate over three months raises a half-percentage point or more above its low over the previous year, the economy is in a recession. The best outcome, for now, would be for inflation to start cooling and for the unemployment rate to stabilize, allowing the Fed to avoid slamming the brakes on the economy. There aren’t any guarantees that that is the outcome we will ultimately get, but recently that’s what has played out. The rate of increase for the Federal Reserve’s preferred inflation gauge, the Personal-Consumption Expenditures (PCE) price index’s annual gain in May was +6.3%, the same as in April and down from +6.6% in March. Excluding food and energy, the PCE index was up +4.7% from a year earlier, the third month in a row that Core PCE declined. That remains well above the Fed’s 2% target but shows inflation may be peaking. The Bloomberg Commodity Index and WTI crude oil are both about -15% from their 2022 all-time highs, also indicating cooling inflation. Meanwhile, the June jobs report showed the unemployment rate remained at a 3.6% level for the fourth straight month, which is just a hair above the 50-year low of 3.5% reached before the pandemic hit in early 2020.
Recession Spotting
The Sahm rule, named for economist Claudia Sahm, says that when the three-month average jobless rate has risen 0.5 percentage point from its previous 12-month low, the U.S. is in recession.
Source: Claudia Sahm via the St Louis Fed, The Wall Street Journal
Economic Review
- The U.S. economy added 372,000 jobs in June, well above expectations for 265,000, while May’s figure was revised downward to 384,000 from the initial reading of 390,000. Excluding government jobs, private sector payrolls grew by 381,000, far above forecasts for 233,000, after increasing by 336,000 in May, revised up from 333,000. The labor force participation rate unexpectedly slipped to 62.2% from 62.3% in May, under forecasts for a rise to 62.4%. The unemployment rate remained at 3.6% for the fourth straight month, matching expectations. The underemployment rate—including total unemployed and those employed part-time for economic reasons, along with people who are marginally attached to the labor force—declined to 6.7% from 7.1%. Average hourly earnings were up +0.3%, matching expectations, but below May’s upwardly revised 0.4%. Compared to last year, wages were +5.1% higher, beating expectations for +5.0%, but below May’s 5.3%. Average weekly hours remained at May’s downwardly revised 34.5, below expectations of 34.6. Job gains were prevalent in professional and business services, leisure and hospitality, and health care.
- The Labor Department’s Job Openings and Labor Turnover Survey (JOLTS), a measure of unmet demand for labor, declined to 11.3 million jobs available to be filled in May, down from April’s upwardly revised level of 11.7 million and estimates for 11.0 million. The hiring rate remained at April’s 4.3% level, and separations also held at April’s 3.9% rate. The quit rate dipped to 2.8% from April’s 2.9% pace.
- May Factory Orders increased +1.6% for the month, well above expectations for 0.5%, and the prior month’s +0.3% gain was revised higher to +0.7%. Durable Goods Orders were revised higher to +0.8% from the preliminarily report two weeks ago. Overall, the report shows that order activity across the board was much stronger than expected in May.
- The June Institute for Supply Management (ISM) Services Index showed services expansion decelerated by a smaller amount than expected. The index slipped to 55.3 from 55.9 in May, well above expectations for a decrease to 54.0 (readings above 50 represent economic expansion). An acceleration in business activity helped offset a deceleration in new orders growth and a decline in employment month-over-month, which moved back into contraction territory. New export orders fell but continued to grow at a solid pace, inventories also declined but continued to expand, and prices paid decreased from the prior month.
- The final June S&P Global Services PMI Index was revised higher to 52.7 from the preliminary 51.6 level, where it was expected to remain, but was below May’s 53.4.
- The Federal Reserve released the minutes from the June FOMC monetary policy meeting, at which it increased rates by 75 bps—the first hike of that amount since 1994. The Committee stressed the need to get control inflation even if it meant a slowdown in the economy. The minutes said, “In discussing potential policy actions at upcoming meetings, participants continued to anticipate that ongoing increases in the target range for the federal funds rate would be appropriate to achieve the Committee’s objectives,” adding, “In particular, participants judged that an increase of 50 or 75 basis points would likely be appropriate at the next meeting.”
- May Wholesale Inventories were up +1.8% for the month, revised lower from the previously reported +2.0% gain, where forecasts called for it to remain, and below April’s 2.3% increase.
- May Consumer credit increased by $22.3 billion, below expectations of $30.9 billion, but April was adjusted downward to an increase of $36.8 billion from the originally reported $38.1 billion. Non-revolving debt, which includes student loans and loans for vehicles and mobile homes, was $14.9 billion, a +5.2% increase from last year, while revolving debt, which includes credit cards, came in at $7.5 billion, an +8.1% increase from last year.
- The weekly MBA Mortgage Application Index broke its three-week win streak, falling -5.4%. The Refinance Index fell -7.7% from last week and the Purchase Index was down -4.3% for the week. The decline came even as the average 30-year mortgage rate slipped -10 basis points (bps) to 5.74% but is still up +259 bps from last year.
- Weekly Initial Jobless Claims were 235,000, for the week ended July 2, above expectations for 230,000, but below the prior week’s upwardly revised 231,000. Continuing Claims for the week ended June 25 were down 51,000 to 1,375,000, above expectations of 1,328,000.
The Week Ahead
A key question for markets is when will inflation peak, so the June inflation date will be closely watched, and the Consumer Price Index (CPI), Producer Price Index (PPI), and the Import Price Index all report this week. The June CPI on Wednesday is expected to show headline inflation rising above May’s 8.6% level. In addition, the second quarter earnings season kicks off this week with reports from PepsiCo, Delta Air Lines, and Taiwan Semiconductor before a slew of reports from major banks like JPMorgan Chase, Wells Fargo, U.S. Bancorp, and others.
Did You Know?
DIRTY LAUNDRY – The price to launder a shirt at Yale Cleaners in Tulsa, Oklahoma is $3.55, up from $2.65 before the pandemic. Dry cleaners were already hurting after the pandemic drove millions of people to work from home. Now they are raising prices as the costs of starch, steam irons, clothes hangers and utilities have climbed in the past year. There are also rising costs associated with the continuing labor shortage (source: The Wall Street Journal).
SUMMER COOKOUT – The average cost of a summer cookout for 10 people this year is $69.98, up +17% from last year. There doesn’t appear to be any relief on the horizon for consumers. Some of the nation’s biggest food suppliers have said they would continue to raise prices as they face higher costs for labor, packaging, ingredients, and transportation (source: American Farm Bureau Federation, The Wall Street Journal).
KENNEL COSTS – The price for boarding pets has gone up +10%-15% compared with before the pandemic, according to Carmen Rustenbeck, chief executive and founder of the International Boarding and Pet Services Association. Higher demand and a lack of available staff this summer have made finding a pet sitter difficult (source: The Wall Street Journal).
This Week in History
JOURNAL TIME – On July 8, 1889, the first issue of The Wall Street Journal was published by Charles Henry Dow, Edward Davis Jones, and Charles M. Bergstresser (source: The Wall Street Journal).
Asset Class Performance
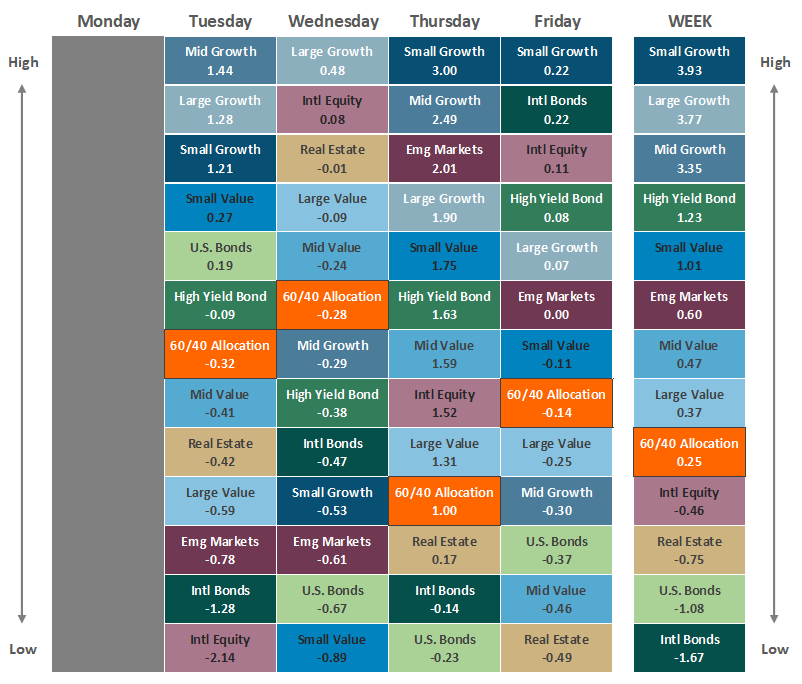
The Importance of Diversification. Diversification mitigates the risk of relying on any single investment and offers a host of long-term benefits, such as lowering portfolio volatility, improving risk-adjusted returns, and helping investments to compound more effectively.
Source: Bloomberg. Asset‐class performance is presented by using market returns from an exchange‐traded fund (ETF) proxy that best represents its respective broad asset class. Returns shown are net of fund fees for and do not necessarily represent the performance of specific mutual funds and/or exchange-traded funds recommended by The Retirement Planning Group. The performance of those funds may be substantially different than the performance of the broad asset classes and to proxy ETFs represented here. U.S. Bonds (iShares Core U.S. Aggregate Bond ETF); High‐Yield Bond (iShares iBoxx $ High Yield Corporate Bond ETF); Intl Bonds (SPDR® Bloomberg Barclays International Corporate Bond ETF); Large Growth (iShares Russell 1000 Growth ETF); Large Value (iShares Russell 1000 Value ETF); Mid Growth (iShares Russell Mid-Cap Growth ETF); Mid Value (iShares Russell Mid-Cap Value ETF); Small Growth (iShares Russell 2000 Growth ETF); Small Value (iShares Russell 2000 Value ETF); Intl Equity (iShares MSCI EAFE ETF); Emg Markets (iShares MSCI Emerging Markets ETF); and Real Estate (iShares U.S. Real Estate ETF). The return displayed as “Allocation” is a weighted average of the ETF proxies shown as represented by: 30% U.S. Bonds, 5% International Bonds, 5% High Yield Bonds, 10% Large Growth, 10% Large Value, 4% Mid Growth, 4% Mid Value, 2% Small Growth, 2% Small Value, 18% International Stock, 7% Emerging Markets, 3% Real Estate.
Chris Bouffard is CIO of The Retirement Planning Group (TRPG), a Registered Investment Adviser. He has oversight of investments for the advisory services offered through TRPG.
Disclaimer: Information provided is for educational purposes only and does not constitute investment, legal or tax advice. All examples are hypothetical and for illustrative purposes only. Past performance of any market results is no assurance of future performance. The information contained herein has been obtained from sources deemed reliable but is not guaranteed. Please contact TRPG for more complete information based on your personal circumstances and to obtain personal individual investment advice.


