Market Performance Summary
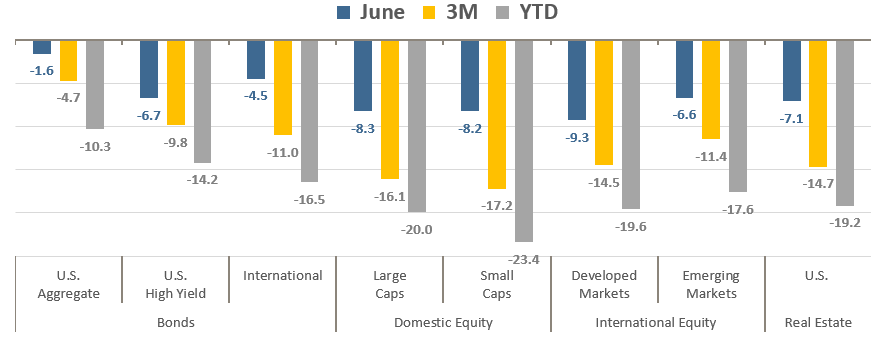
June capped another difficult month, and quarter, for virtually all asset classes. As shown in the table below, all major asset classes declined in the month, and the quarter ended in June. And following the first quarter of 2022, which was also negative for all major asset classes, this is now the worst first half of the year for stocks since Richard Nixon’s first Presidential term. For bonds it was even worse — the drop in the key Bloomberg Aggregate Bond Index was the worst ever to start a year as the Federal Reserve raised rates aggressively to stem persistently high inflation. For diversified investors, having both bonds and stocks tagged with the worse start to the year in more than 50+ years is, but as we discuss further below it actually sounds a lot worse than it is (see “It’s certainly not good, but it’s not as bad as it looks” below for more details).
Asset Class Total Returns
Source: Bloomberg, as of June 30, 2022. Performance figures are index total returns: U.S. Bonds (Barclays U.S. Aggregate Bond TR), U.S. High Yield (Barclays U.S. HY 2% Issuer-Capped TR), International Bonds (Barclays Global Aggregate ex USD TR), Large Caps (S&P 500 TR), Small Caps (Russell 2000 TR), Developed Markets (MSCI EAFE NR USD), Emerging Markets (MSCI EM NR USD), Real Estate (FTSE NAREIT All Equity REITS TR).
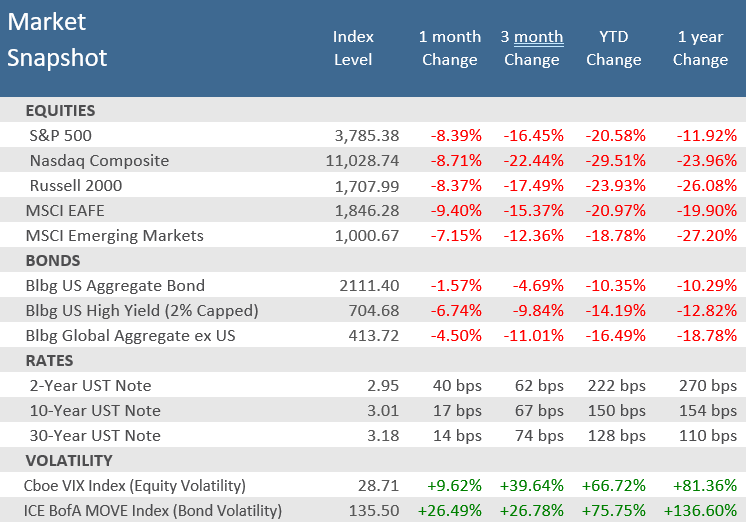
Well, there has been no summer doldrums for investors in 2022 – typically a quiet season for Wall Street. June brought more volatility to an already volatile year. As seen in the Market Snapshot table below, the S&P 500 Index fell -8.4% in June, leaving it down -16.5% for the second quarter and -20.6% for the first half of the year. At the bottom of the table is the Cboe VIX Volatility Index, a gauge of the price variability of the S&P 500, and it is up nearly +40% in the second quarter and +67% in the first half of 2022. And as big as the volatility spikes are for stocks, bonds have also jumped by surprisingly large amounts. In June alone, the ICE BoA MOVE Index, a gauge of Treasury Bond volatility, surged +26.5%, and is up about the same for the second quarter, and up a whopping 75% in the first half of the year.
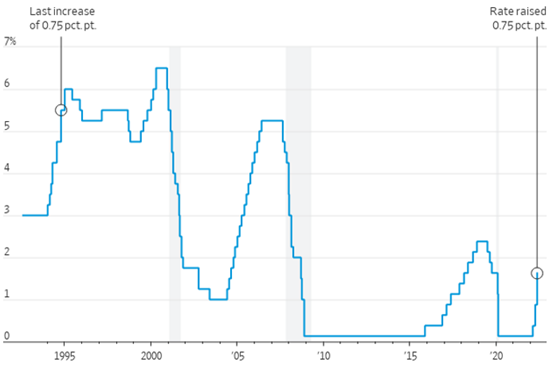
A primary catalyst for the surging volatility, and declining prices, for stocks and bonds has been an increasingly aggressive Federal Reserve with the first 0.75% rate hike during the month for the first time since 1994. Indeed, rising inflation and interest rates have fueled a months-long rout across almost all asset classes to start the year. About the only thing that rose in the first half were Commodities and the U.S. dollar. The WSJ Dollar Index, which measures the dollar against a basket of 16 currencies, has increased +8.7% this first half of the year. That puts it on pace for its best first half since 2010, when it gained +8.8%.
Unfortunately, more volatility may be ahead because other global central banks have joined the Fed in raising interest rates to try to rein in inflation. The central banks of England, Switzerland, Taiwan, and Brazil among others have all hiked rates as inflation remains elevated globally. As a result, global economic growth will likely slow down, indications are that it already is, and potentially tip economies into recession, thereby further spurring volatility across markets.
Source: Bloomberg.
Price Returns for Equity, Total Returns for Bonds.
Quick Takes
It’s Certainly Not Good, But It’s Not As Bad As It Looks.
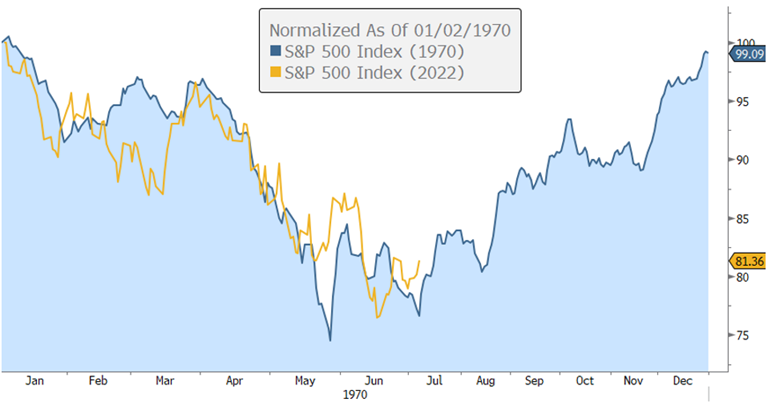
The headlines are everywhere: it’s the worst six-month start to the year for stocks in 50 years, since 1970! That sounds really bad and demands your attention. No wonder media outlets from The Wall Street Journal, Barrons, Bloomberg, Kiplinger, Fortune, CBS, Time, Financial Times, BBC, and many others all hyped the “Worst First Half in 50 Years” theme. Now, this isn’t an attempt to sugarcoat what is undeniably a very unpleasant start to the year for investors. However, a little context helps put some perspective on the alarming headlines. The first place to start is that there is no magical meaning to the first half of a calendar year. After all, why should that be any more significant than any other six-month period? The S&P 500 has fallen -20% or more in 13 other six-month periods since 1957, or about every 5 years on average. That’s never fun, but it isn’t uncommon and alarming like the headlines would indicate. Actually, seven of the eight worst 6-month drops have occurred in the 20 years from 2002 through 2021, so about every 3 years on average. And yet, over that 20-year period, the S&P 500 returned a total gain of +516% (including dividends), or an annual average of +9.5%. According to Bloomberg, the annual average total return for the S&P 500 from 1928 to 2021 was… +9.7%, or about the same as the 20 years with all those bad 6-month periods. And does a dismal first-half performance mean a dismal second half? According to an analysis by S&P Dow Jones Indices, historically there has been little to no correlation between the index’s performance in the first and second half of the year. Going back to the “worst first half since 1970” theme, the S&P 500 lost -21% in the first half of 1970, also a period of persistent inflation. What happened in the second half? It gained +27% and finished the year positive. during the last six months of that year. A single example is a long way from statistical significance, but the S&P Dow Jones analysis shows that since 1957, in the years when the S&P 500 was negative in the first half of the year, it was negative in the second half of the year about 50% of the time, or essentially a coin flip.
Remember 1970?
The S&P 500 fell in the first half, but rebounded in the second half
Source: Bloomberg. Data for 2022 through July 7.
Fed Implements the Largest Interest Rate Hike Since 1994.
The Federal Open Market Committee (FOMC) concluded the June 14-15 monetary policy meeting with the largest interest rate increase since 1994 (0.75 basis points) and signaled it would continue lifting rates this year at the most rapid pace in decades as it races to slow the economy and combat inflation that is running at a 40-year high. It also said it will maintain its plans of reducing its balance sheet via its holdings of Treasury securities and agency debt and mortgage-backed securities.
Fed Raises Rates by 0.75 Percentage Point
Largest Increase Since 1994
Note: Chart shows midpoint of range since 2008.
Source: Federal Reserve, The Wall Street Journal.
Recession Probability Rises With Rates.
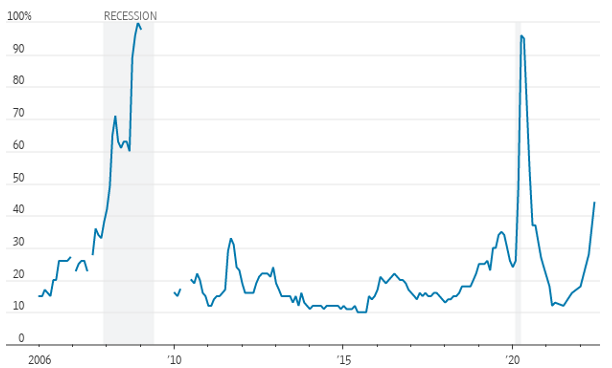
With the Fed hiking rates at the most aggressive rate in decades, many are reassessing the risks it poses to economic growth. The same week that the Fed hiked rates by 0.75 percentage points, stocks had their worst week since 2020 and entered bear market territory (a -20% decline from the previous peak), the Cboe VIX Volatility Index spiked above 30, the 2-year/10-year Treasury yield curve moved towards inversion again (and did invert in early July), housing market data tumbled, and the Atlanta Fed GDPNow real-time GDP estimate for Q2-2022 fell to zero (and went negative on the last day of June). Wall Street investment banks like Goldman Sachs, Nomura, Citi, and Deutsche Bank all released recession risk warnings. Likewise, the economists surveyed by The Wall Street Journal have also raised the probability of recession, now putting it at 44% in the next 12 months, a level usually seen only on the brink of or during actual recessions. That’s up from 28% in the Journal’s prior survey in April and just 18% in January. Since the Journal began asking the question in mid-2005, a 44% recession probability is seldom seen outside of an actual recession.
Probability the U.S. is in a recession in next 12 months including today
Note: Gaps indicate question not asked or data unavailable.
Source: Wall Street Journal surveys of economists
Stranger Things.
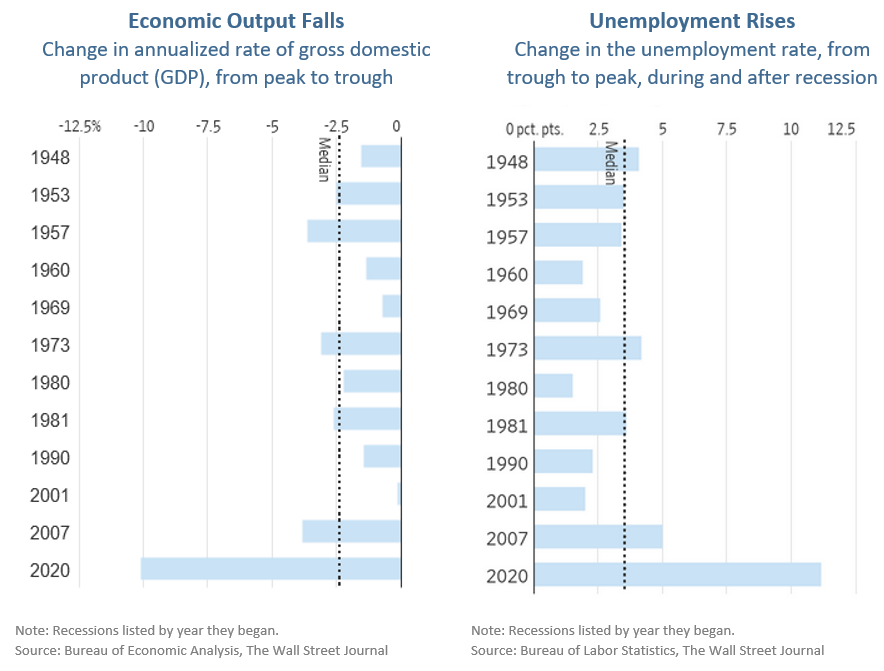
If the U.S. is in, or near, a recession, it’s a very strange one. The U.S. economy has experienced 12 recessions since World War II, and each one included two features: Economic output contracted while unemployment rose. But in 2022, something highly unusual is happening. Economic output fell in the first quarter and signs suggest it did so again in the second. Yet the job market showed little sign of faltering during the first half of the year. The unemployment rate fell from 4% last December to 3.6% in May, and expectations are for it to remain there for June. It is the latest twist in the unusual course of the pandemic economy, and a conundrum for those watching for a recession. If the U.S. is in or near one, it doesn’t yet look like any other on record. The term “jobless recoveries” has characterized past recessions, in which economic output rose but employers reduced their workforce. But the first half of 2022 was the exact opposite—a “jobful downturn”, in which economic output fell yet companies kept hiring. Whether it will escalate into a fuller and deeper recession isn’t known, but both economists’ surveys and economic models show the risk of recession has risen considerably over the second quarter (see “Recession Risk on the Rise” below). Nevertheless, at least historically, the unemployment rate has increased in every recession, by a minimum of 1.9 percentage points in 1960 and 1961 and as much as 11.2 percentage points in 2020. The median increase in the unemployment rate among all 12 post-World War II recessions was 3.5 percentage points and the jobless rate overall level was at least 6.1% in any of those past recessions.
Other Recession Cushions.
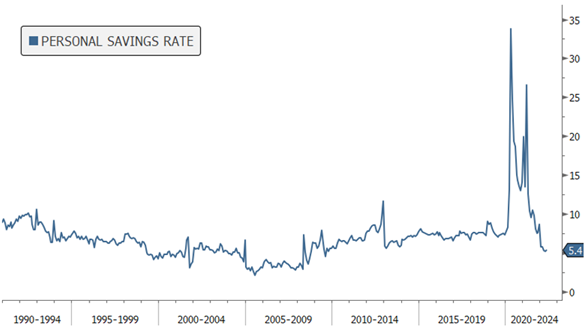
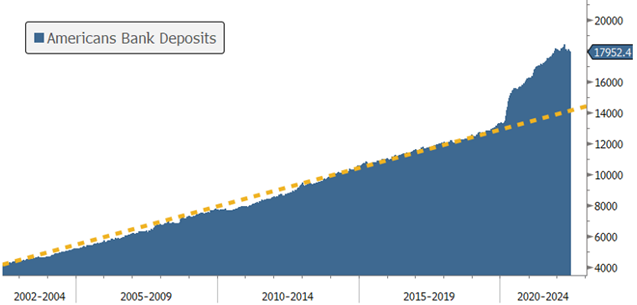
Beyond the healthy labor market and still expanding economy, there are other areas of strength remaining that would likely keep any potential recession from being deep or long. U.S. households, corporations and banks are all in much better condition than in past economic downturns. Some have pointed to the considerably lower U.S. Savings Rate as evidence of recessionary conditions but fail to consider the actual savings accumulated over the last two years. Yes the nation’s personal savings rate, which soared during the early months of the pandemic, has now fallen back to below its pre-pandemic levels. The savings rate was 7.8% in January 2020, rose to 33.8% in April 2020, but fell to just 4.4% in April 2022. The 4.4% rate was the lowest recorded in the United States since September 2008. However, it bounced back to 5.4% in May, the latest reading and even with the pullback in savings rate, the actual amount of savings deposits is well above the long-term trend and may help cushion a pullback in economic activity.
Savings Rates have declined considerably since the pandemic surge…
Source: Bloomberg. Data as of: 05/31/2022.
Savings Rates have declined considerably since the pandemic surge…
Source: Bloomberg. Data as of: 06/30/2022.
Did “Pain at the Pump” Peak?
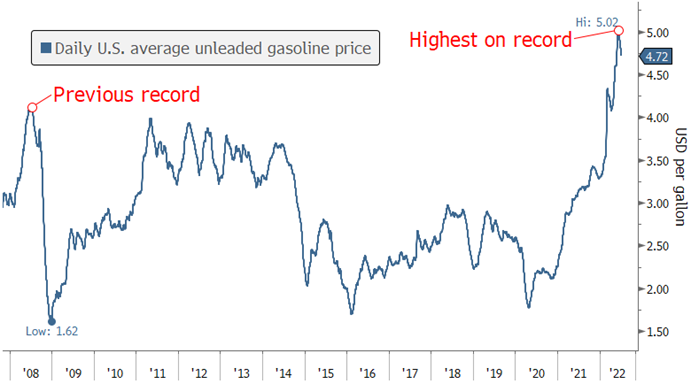
Rising fuel prices are a big component of inflation and U.S. consumer sentiment. As featured last month, the summer of 2022 has brought a surge of gasoline prices, which exceeded $5 per gallon in June. Fortunately, there are signs that gasoline prices may have peaked. Since mid-June, crude oil prices, which make up about 60% of the cost of gasoline, have lost steam and traded below $100 on July 6th. Gasoline prices have fallen more slowly but are down below $4.75 per gallon according to AAA data, and are below $4.50 in 13 states. The drop in gasoline prices should bring welcome relief to U.S. consumers.
Has the Price of Gasoline Peaked?
Daily National Average Gasoline Prices Regular Unleaded
Source: American Automobile Association (AAA), Bloomberg. Data as of July 7, 2022.
Looking Forward.
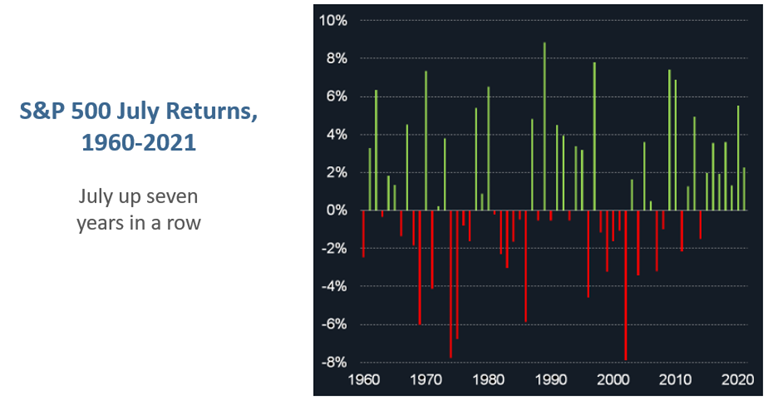
July has been a positive month for the S&P 500 32 times and a negative month 30 times since 1960. But recent history has been much more favorable than the early history. July tended to be one of the weaker months of the year from 1960 to 1991—posting the second-worst median return (-0.4%) and second-worst win percentage (44%)—but it’s been more positive since then, with a median return of +1.5% and a 60% win percentage. Much of that bullish behavior has been concentrated in the past 13 years, when July has been up 11 times (including the past seven straight years) with a median return of +2.3%.
Source: Power E*TRADE..
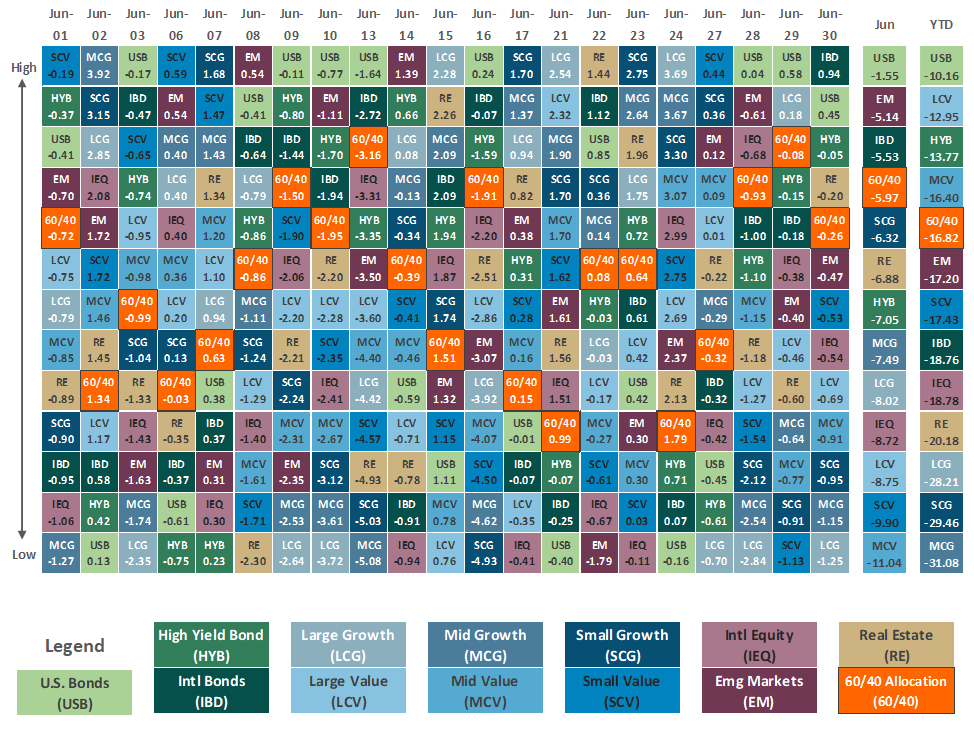
Asset Class Performance
The Importance of Diversification. Diversification mitigates the risk of relying on any single investment and offers a host of long-term benefits, such as lowering portfolio volatility, improving risk-adjusted returns, and helping investments to compound more effectively.
Source: Bloomberg. Asset‐class performance is presented by using market returns from an exchange‐traded fund (ETF) proxy that best represents its respective broad asset class. Returns shown are net of fund fees for and do not necessarily represent performance of specific mutual funds and/or exchange-traded funds recommended by The Retirement Planning Group. The performance of those funds may be substantially different than the performance of the broad asset classes and to proxy ETFs represented here. U.S. Bonds (iShares Core U.S. Aggregate Bond ETF); High‐Yield Bond (iShares iBoxx $ High Yield Corporate Bond ETF); Intl Bonds (SPDR® Bloomberg Barclays International Corporate Bond ETF); Large Growth (iShares Russell 1000 Growth ETF); Large Value (iShares Russell 1000 Value ETF); Mid Growth (iShares Russell Mid-Cap Growth ETF); Mid Value (iShares Russell Mid-Cap Value ETF); Small Growth (iShares Russell 2000 Growth ETF); Small Value (iShares Russell 2000 Value ETF); Intl Equity (iShares MSCI EAFE ETF); Emg Markets (iShares MSCI Emerging Markets ETF); and Real Estate (iShares U.S. Real Estate ETF). The return displayed as “Allocation” is a weighted average of the ETF proxies shown as represented by: 30% U.S. Bonds, 5% International Bonds, 5% High Yield Bonds, 10% Large Growth, 10% Large Value, 4% Mid Growth, 4% Mid Value, 2% Small Growth, 2% Small Value, 18% International Stock, 7% Emerging Markets, 3% Real Estate.
Chris Bouffard is CIO of The Retirement Planning Group (TRPG), a Registered Investment Adviser. He has oversight of investments for the advisory services offered through TRPG.
Disclaimer: Information provided is for educational purposes only and does not constitute investment, legal or tax advice. All examples are hypothetical and for illustrative purposes only. Past performance of any market results is no assurance of future performance. The information contained herein has been obtained from sources deemed reliable but is not guaranteed. Please contact TRPG for more complete information based on your personal circumstances and to obtain personal individual investment advice.

