Quick Takes
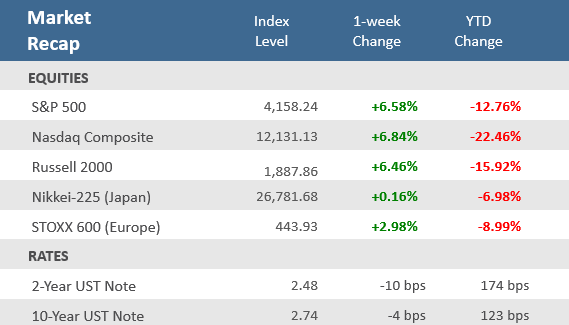
- What a difference a week makes. After the first seven week losing streak since 2001, the S&P 500 was flirting with bear-market levels last Friday. The S&P gained +2.5% on Friday alone, putting it up +6.6% for the week, its best since November 2020. The tech-heavy Nasdaq rebounded +6.8% after its own seven week losing streak. The S&P 500 is now down -12.8% for the year, while the Nasdaq remains in bear market territory at -22.5%.
- It’s not just equities that have rebounded. Bond yields have been retreating for almost three weeks now, after hitting their highest levels since November 2018 on May 9th. That resulted in the Bloomberg Aggregate Bond Index increasing +0.8% for the week, its third straight week of gains (bond prices move in the opposite direction of bond yields).
- The April Core Personal Consumption Expenditures (PCE) price index rose at an annual rate of +4.9%, in line with estimates and down from +5.2% in March. This inflation gauge is watched closely by the Federal Reserve when setting monetary policy. Headline PCE rose just +0.2% on a monthly basis for April, a sharp drop from the +0.9% increase for March.
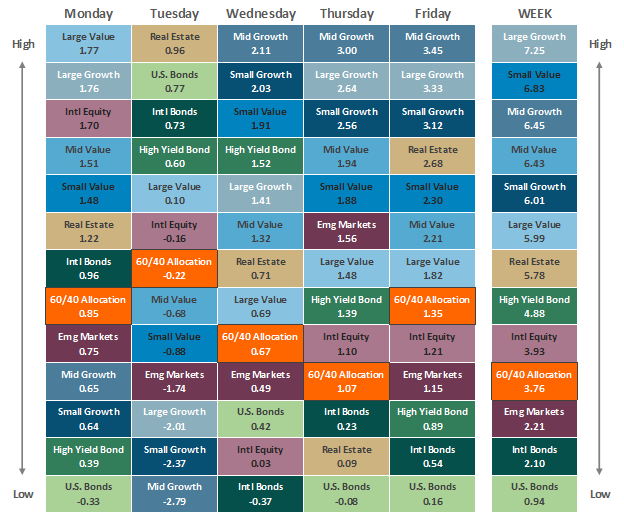
All major asset classes were up for the week, most up big
For the first time in 2022, virtually all major asset classes rose for the week, most breaking multi-week losing streaks. Basically, only the U.S. dollar and crypto assets fell. The Dow Jones Industrial Average snapped an eight week losing streak, the S&P 500 and Nasdaq Composite indexes broke seven week losing streaks, and the small cap Russell 2000 index broke a five week losing streak. Large Growth was the best performing asset class over the week, with a +7.3% jump, but remains the third worst performer for the year down -21.5% (only outdone to the downside by Small Growth and Mid Growth, down -23.6% and -24.3% respectively).
For the hypothetical 60% equity / 40% bond portfolio used as the benchmark in the “Asset Class Performance” table at the end of this publication every week, it had also struggled with a seven week losing streak that was broken this past week. The +3.8% gain was easily its best week of the year. It was only the fourth positive week of the 21 weeks completed thus far in 2022. Year-to-date, the hypothetical benchmark portfolio is still down -11.0%.
Bonds have quietly built a multi-week win streak, with their third consecutive weekly gain. U.S. Bonds lagged the other major asset classes but still advanced +0.9% for the week (the Bloomberg Aggregate Bond Index was up 0.8%). The yield on the U.S. 10-year Treasury note declined to 2.74%, its lowest weekly closing price since April 8th.
Bond yields have been retreating for three weeks now, as the markets readjust rate expectations for the rest of the year. Signs that economic growth continues to slow and less hawkish tones from members of the Federal Reserve have resulted in the market reeling in how much they are expecting the Fed to raise rates. Currently, markets see the federal funds target reaching a terminal rate of just below 3%. That is down from about 3.5% a little more than a week ago. On Wednesday, investors shrugged off the release of minutes from the Fed’s May 3-4 meeting, which showed officials discussed the possibility they would raise interest rates to levels high enough to deliberately slow economic growth as the central bank races to combat high inflation.
During the week, the US Congressional Budget Office (CBO) projected that both inflation and growth will cool later this year and into 2023. The CBO expects a +3.1% growth rate in 2022, down from the +5.5% rate in 2021, and sees the economy growing +2.2% in 2023. It forecasts that inflation will fall to 4.7% in late 2022 and to 2.7% in 2023, while unemployment is expected to remain close to 50-year lows.
About 98% of S&P 500 companies have now reported Q1-2022 earnings, and the earnings growth rate is sitting at +9.7%, according to Bloomberg data. Revenue growth is even higher, at +13.6%, which according to FactSet, would be the fourth highest rate since they began tracking the data in 2008. The pullback in the market this year, combined with still decent earnings growth means that valuations suddenly look quite reasonable. Per FactSet, the 12-month trailing Price/Earnings ratio for the S&P 500 is now below the 5-year and 10-year averages.
Chart of the Week
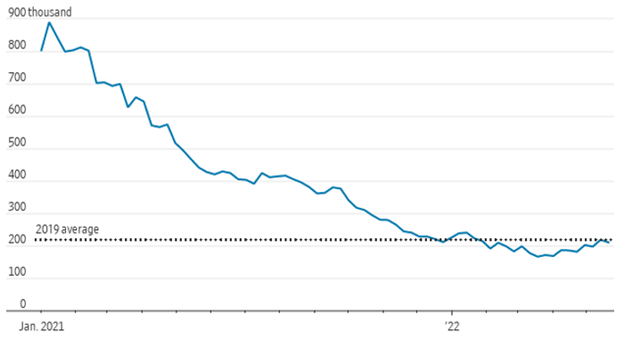
New applications for unemployment benefits (aka, Jobless Claims) fell last week and hovered near historic lows in a sign of a tight U.S. labor market. Initial jobless claims, a proxy for layoffs, decreased to 210,000 for the week ended May 21, below expectations for 215,000 and the prior week’s unrevised 218,000. Continuing Claims for the week ended May 14 increased by 31,000 to 1,346,000, above expectations of 1,310,000 but near decade long lows. The four-week moving average of Jobless Claims rose by 7,250 to 206,750. Other than the pandemic-induced recession of 2020, the U.S. has never had a recession without the 4-week moving average of Jobless Claims spiking +20% or more first. Jobless Claims remain near 2019 pre-pandemic levels, when the job market was also historically tight.
U.S. weekly jobless claims
Source: Federal Reserve via the St. Louis Fed, The Wall Street Journal.
Economic Review
- The second estimate (of three) for Q1-2022 Gross Domestic Product (GDP), the broadest measure of U.S. economic output, was a quarter-over-quarter annualized rate of contraction of -1.5%, revised from the first release’s surprise contraction of -1.4% and below estimates of an adjustment to a -1.3% decrease. Q4-2021 GDP remained unadjusted at a +6.9% increase. Personal consumption was revised to a +3.1% increase, above expectations for an upward revision to +2.8% from the initially reported +2.7% growth. Q4 consumption was unadjusted at a +2.5% gain. The Bureau of Economic Analysis said the downward revision reflected negative adjustments to private inventory investment and residential investment that were partly offset by an upward revision to consumer spending. On inflation, the GDP Price Index was revised to +8.1%, slightly above expectations for an unadjusted +8.0% increase. The Core PCE Price Index rose +4.9% in April, down from the +5.2% pace seen the previous month. This particular report is watched closely by the Federal Reserve when setting policy.
- The April Chicago Fed National Activity Index (CFNAI) increased 0.11 points to 0.47, signaling expanded growth at the start of the second quarter. The three-month average edged down marginally to 0.48 from 0.49, but remains consistent with continued above-trend growth. All four broad categories of indicators made positive contributions and three of the four categories improved from the previous month. The CFNAI Diffusion Index, which is based on 85 individual national economic indicators, was up 0.06 points to 0.48, its highest level since October 2020. Gains were robust with 62 of the 85 monthly indicators making positive contributions. Excluding the current cycle, this was the highest index reading since December 1999. Such broad-based indicator strength reduces the risk of recession in the near term.
- The preliminary May S&P Global U.S. Manufacturing PMI Index declined to 57.5 from an unrevised 59.2 in April, slightly below expectation for a decrease to 57.7. The preliminary S&P Global U.S. Services PMI Index fell to 53.5, well below expectations for a decline to 55.2 from 55.6 in April. However, both indexes’ growth remained above the 50 expansion level. Inflation pressures are still prevalent with S&P noting that input prices moved to the highest level since 2009, but output prices slowed from the record pace set in April.
- The May Richmond Fed Manufacturing Activity Index unexpectedly fell into contraction territory (a reading below zero), plunging to -9 from 14 in April, and far below expectations for a reading of 10. Capacity utilization, new order volume, and shipments dropped into contraction territory, and employment cooled significantly, while prices paid accelerated.
- The May Kansas City Fed Manufacturing Activity Index decelerated by a slower rate than expected and remained comfortably at expansionary levels (above zero). The index dipped to 23 from an unrevised 25 in April, above expectations for a decline to 15.
- Preliminary Durable Goods Orders, which are orders for long-lasting goods such as appliances, computers, and cars, rose +0.4% in the month of April, shy of expectations for a +0.6% increase and below March’s downwardly revised +0.6% increase. Strong consumer spending has boosted manufacturing demand, but a pullback in orders and output could be coming. Large retailers such as Walmart, Target, and Best Buy reported slower sales in some categories, which may be a sign that consumers are slowing purchases of big-ticket items.
- April Personal Income was up +0.4% for the month, slightly below expectations for it to match March’s unrevised +0.5% increase. Personal Spending was up +0.9%, above expectations for +0.8%, but below the prior month’s upwardly revised +1.4%. The Savings Rate as a percentage of disposable income was +4.4% in April, down from March’s downwardly revised +5.0%.
- The May final University of Michigan Consumer Sentiment Index was unexpectedly revised down to 58.4, from the preliminary 59.1 figure, where it was expected to remain. The revision came as both the expectations and current conditions portions of the survey were adjusted lower. The overall index was below April’s 65.2 level and hit the lowest level since August 2011 as both current conditions and expectations were down sharply in the month. The 1-year inflation forecast was revised lower to +5.3% from the preliminary estimate which had it matching the prior month’s +5.4% rate, while the 5-10 year inflation forecast remained at +3.0% for the fourth-straight month.
- April New Home Sales tumbled -16.6% in the month to an annual rate of 591,000 units, far short of expectations of 749,000 units, and below March’s downwardly revised 709,000-units. That was their biggest monthly drop in nine years, the latest sign that higher interest rates may be reducing buyer demand. Even with signs that purchase activity is cooling, price gains are still strong. The median home price rose +19.6% over the year to $450,600. New home inventory rose to 9.0 months from March’s level of a 6.4-months supply at the current sales pace. Sales fell month-over-month in all regions except for the West. Sales in the Northeast were higher year-over-year, while sales in the Midwest, South, and West were lower.
- April Pending Home Sales fell -3.9% in the month—the sixth-straight monthly drop—worse than the expectations for a -2.1% decline and March’s negatively revised -1.6% decrease. Sales tumbled -11.5% year-over-year, well below expectations for a -7.6% decrease, and following March’s negatively revised -9.2% fall. Pending home sales reflect contract signings and are a gauge of the pipeline of existing home sales.
- In other housing news, the weekly MBA Mortgage Application Index fell -1.2% last week, following the prior week’s -11% drop. The Refinance Index fell -3.9% but the Purchase Index was up +0.2%. The average 30-year mortgage rate declined by -3 basis point (bps) to 5.46% but remains up +228 bps from last year.
The Week Ahead
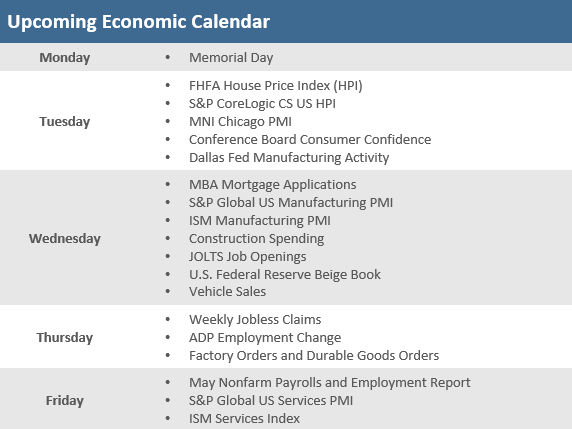
Despite the shortened week from the Memorial Day holiday, the economic calendar will be quite busy. The Conference Board’s Consumer Confidence Index will get the ball rolling, along with the FHFA and S&P CoreLogic Home Price Indices, as well as the ISM and S&P Global Purchase Managers Indices (PMIs). The labor market will also be in focus, with the release of the Job Openings and Labor Turnover Survey (JOLTS), as well as initial jobless claims for the week ended May 28, and of course Friday’s nonfarm payroll report. The Fed will release it Beige Book, offering a look at business activity across the nation ahead of the Central Bank’s June 15 monetary policy decision. Aside from the economic data, there will be several Fed speakers, headlined by the hawkish St. Louis Fed President James Bullard and Fed Vice Chair Lael Brainard.
Did You Know?
BEAT THE (LOSING) STREAK – This week the Dow Jones Industrial Average ended its eighth consecutive week losing streak, its longest such streak since 1932, near the height of the Great Depression. The S&P 500 and Nasdaq Composite indexes ended seven week losing streaks, their longest such streak since 2001, after the dot-com bubble burst (source: The Wall Street Journal).
DANGER ZONE – Small businesses are flashing warning signs on the U.S. economy as inflation, supply-chain snarls, a shortage of workers and rising interest rates darken the outlook for entrepreneurs. 57% of small-business owners expect economic conditions in the U.S. to worsen in the next year, up from 42% in April and equal to the all-time low recorded in April 2020, according to a survey of more than 600 small businesses conducted in May for The Wall Street Journal by Vistage Worldwide. The measure is one part of a broader confidence index that in May posted its largest year-over-year drop since the Covid-related shutdowns of April and May 2020 (source: Vistage Worldwide, The Wall Street Journal).
CASH IS KING – The market is embracing dividend-paying stocks over another longtime favorite, firms that do share buybacks. Lately, many of the stocks with the highest dividend yields in the S&P 500 have been soaring past the broader market. The S&P 500 High Dividend index is up +8.5% in 2022 (total return with dividends reinvested), while the S&P 500 Buyback index has declined -6.6% in 2022 (total return with dividends reinvested) (source: Bloomberg, The Wall Street Journal).
This Week in History
HAPPY 126TH – On May 25, 1896, the Dow Jones Industrial Average was first published. Its 12 initial members were the great industrial giants of the time: American Cotton Oil, American Sugar, American Tobacco, Chicago Gas, Distilling & Cattle Feeding, General Electric, Laclede Gas, National Lead, North American, Tennessee Coal & Iron, U.S. Leather, and U.S. Rubber. The Dow’s value that day was 40.94. On Friday it closed at 33,212.96, down -8.6% from its all-time high of 36,799.65 set on January 4, 2022 (source: The Wall Street Journal, Bloomberg).
Asset Class Performance
Source: Bloomberg. Asset‐class performance is presented by using market returns from an exchange‐traded fund (ETF) proxy that best represents its respective broad asset class. Returns shown are net of fund fees for and do not necessarily represent the performance of specific mutual funds and/or exchange-traded funds recommended by The Retirement Planning Group. The performance of those funds may be substantially different than the performance of the broad asset classes and to proxy ETFs represented here. U.S. Bonds (iShares Core U.S. Aggregate Bond ETF); High‐Yield Bond (iShares iBoxx $ High Yield Corporate Bond ETF); Intl Bonds (SPDR® Bloomberg Barclays International Corporate Bond ETF); Large Growth (iShares Russell 1000 Growth ETF); Large Value (iShares Russell 1000 Value ETF); Mid Growth (iShares Russell Mid-Cap Growth ETF); Mid Value (iShares Russell Mid-Cap Value ETF); Small Growth (iShares Russell 2000 Growth ETF); Small Value (iShares Russell 2000 Value ETF); Intl Equity (iShares MSCI EAFE ETF); Emg Markets (iShares MSCI Emerging Markets ETF); and Real Estate (iShares U.S. Real Estate ETF). The return displayed as “Allocation” is a weighted average of the ETF proxies shown as represented by: 30% U.S. Bonds, 5% International Bonds, 5% High Yield Bonds, 10% Large Growth, 10% Large Value, 4% Mid Growth, 4% Mid Value, 2% Small Growth, 2% Small Value, 18% International Stock, 7% Emerging Markets, 3% Real Estate.
Chris Bouffard is CIO of The Retirement Planning Group (TRPG), a Registered Investment Adviser. He has oversight of investments for the advisory services offered through TRPG.
Disclaimer: Information provided is for educational purposes only and does not constitute investment, legal or tax advice. All examples are hypothetical and for illustrative purposes only. Past performance of any market results is no assurance of future performance. The information contained herein has been obtained from sources deemed reliable but is not guaranteed. Please contact TRPG for more complete information based on your personal circumstances and to obtain personal individual investment advice.


