Market Performance Summary
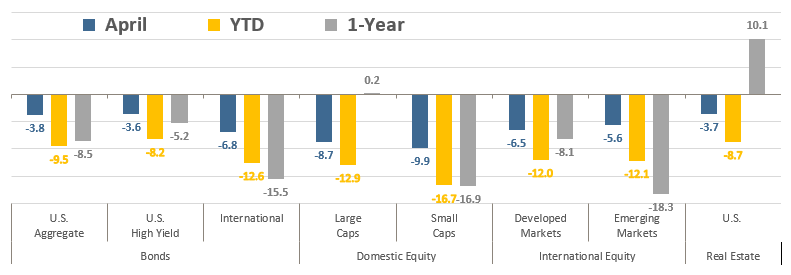
Well, the reprieve from negative returns in March for U.S. and developed international stocks, along with Real Estate, was short lived. Investors looking for further respite after the negative and volatile first quarter instead found another decidedly bad month. There was nowhere to hide in April, with all major asset classes suffering substantial losses for the month. The April losses pulled year-to-date losses even further into negative territory and leaves only real estate with a visible positive trailing 1-year return. Aggressive Fed tightening expectations, the ongoing war in Ukraine, China’s COVID lockdowns, and persistently high inflation are all weighing on investor sentiment.
Asset Class Total Returns
Source: Bloomberg, as of April 30, 2022. Performance figures are index total returns: U.S. Bonds (Barclays U.S. Aggregate Bond TR), U.S. High Yield (Barclays U.S. HY 2% Issuer-Capped TR), International Bonds (Barclays Global Aggregate ex USD TR), Large Caps (S&P 500 TR), Small Caps (Russell 2000 TR), Developed Markets (MSCI EAFE NR USD), Emerging Markets (MSCI EM NR USD), Real Estate (FTSE NAREIT All Equity REITS TR).
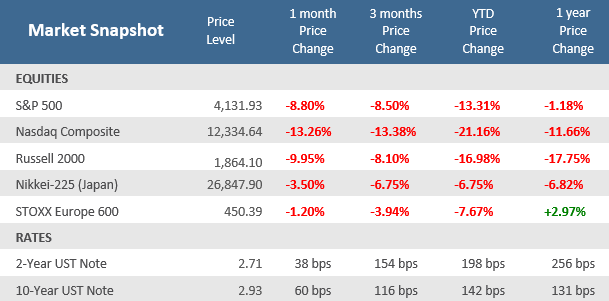
Just how bad was it in April? For U.S. stocks, as measured by the S&P 500, the -8.7% decline in April was the worst month since March 2020. But it was even worse for technology and growth-oriented stocks, as witnessed by the Nasdaq Composite’s -13.2% monthly plunge, which left the index in bear market territory (more than 20% below its November all-time high), and at its lowest level since December 2020. International stocks got a late month bump that helped them outperform those in the US in April and also helped them pull ahead for the year, though they were still negative for both periods (the MSCI EAFE Index of developed markets was down -6.5% in April, and -12.0% in 2022). Of course, one of the most challenging aspects of 2022 is that fixed income securities are also falling with equities. As interest rates continued to rise in April, bond prices, which move in the opposite direction, continued to fall. The benchmark 10-year Treasury yield climbed to 2.93% to finish the month—its highest monthly close since November 2018. The 2-year yield finished April at 2.71%, so the yield curve between it and the 10-year remained positive since its brief inversion at the end of March and the start of April. The Bloomberg US Aggregate Bond Index fell -3.8% in April, its fifth consecutive negative month – the longest losing streak since June 1994 and the index’s worst month since February 1980. Although the quick rise in bond yields has been unpleasant from a return perspective, the higher yields are beginning to become attractive for income investors for the first time in a long while, which may provide some demand for them as the year progresses.
Source: Bloomberg.
Quick Takes
We’ve been here before.
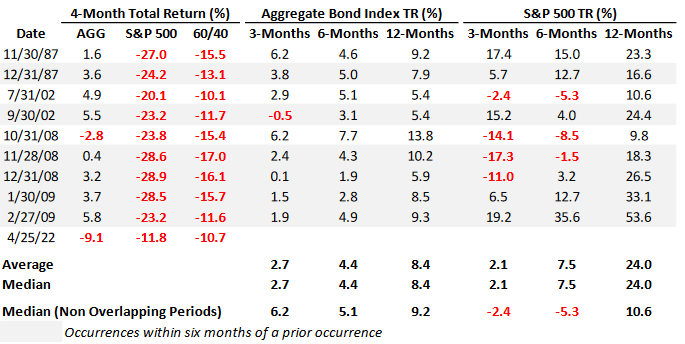
In years like 2022, it’s helpful to remember that volatility, as unpleasant as it is, is the price that long-term investors must bear to achieve the long-term average returns that history has consistently provided. Even in years like 2022, with both stocks and bonds struggling, keeping a historical perspective can help provide context. The markets have eventually resolved their challenges and rewarded investors who stay the course. As markets digests persistent inflation, the Fed rate hikes, the uncertainty of COVID lockdowns in China, and a war in Ukraine, the traditional 60/40 stock and bond portfolio has had one of its worst four months periods. A 60/40 portfolio (60% S&P 500 and 40% Bloomberg Aggregate Bond Index) is down -10.7% so far in 2022 through April. The table below from Bespoke Investment Group lists every month end since 1977 when the 60/40 portfolio fell more than 10% over a rolling four-month basis. In some cases, occurrences were bunched in clusters, so the shaded months indicate periods that occurred within six months of a prior occurrence. Looking forward, performance was generally positive. Bonds were up over the following six and twelve months every time, and the S&P 500 was higher a year later every time.
Four Month Declines of 10%+ in 60/40 Portfolios: 1977 – 2022
Source: Bespoke Investment Group.
This is Actually Normal.
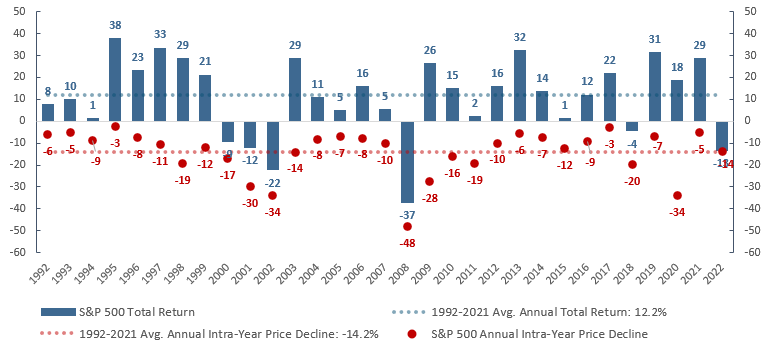
This is an exhibit we use frequently, especially in years like 2022. As of the end of April, the S&P 500 Index has fallen -13.9% from its all-time high set on the first trading day of this year (1/3/2022). That peak to trough decline is essentially right at the intra-year average decline of -14.2% over the last 30 years. In other words, this year is fairly average so far. LPL Research points out that in the context of a midterm election year, this is actually better than average so far, because midterm years tend to be especially volatile with an average market decline of -17%. The good news for long-term investors is that markets are resilient, and stocks have rebounded +32% on average in the 12 months following those mid-term lows. And of the last 21 times the S&P 500 has seen a double-digit drawdown in a calendar year, stocks have rallied back to end the year positive 12 times with an average gain of +17% at the end of the year.
S&P 500 intra-year declines vs. calendar year returns
Despite average intra-year price declines of -14.2%,
annual total returns were positive in 25 of 30 years, or 83% of the years.
Earnings.
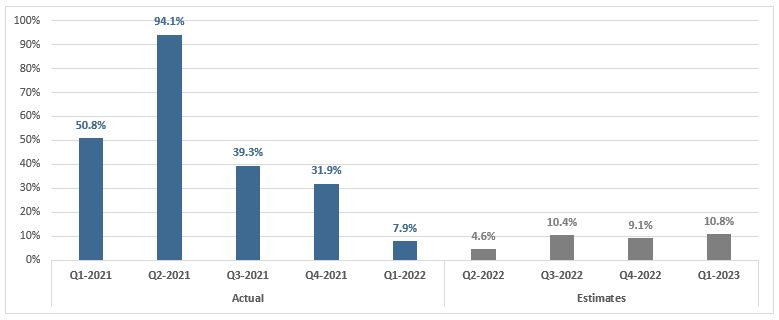
Q1-2022 earnings season grinds on and of the 432 S&P 500 companies that have reported thus far, roughly 67% have topped sales expectations and about 78% have exceeded earnings expectation, per data compiled by Bloomberg. That puts year-over-year sales growth to be tracking up +14.4%, and earnings growth to be 7.9% higher. Unfortunately, some of the largest and most influential companies have seen a sharp deceleration in growth, with Netflix, Amazon, and Meta Platforms (Facebook) all posting their lowest revenue growth rates in company history. But while the overall pace of earnings growth for the S&P 500 is moderating from the torrid rates seen in the first half of last year, it remains right about the 20-year average of 8%. Furthermore, even with the S&P 500 falling in April and year-to-date, forward earnings estimates for Q2-2022 through Q4-2022 have been going higher since the start of the year. Usually, earnings estimates are revised lower as the we progress throughout the year. The -13% pullback in the S&P 500 with the positive earnings growth has led to a -20% decline in the 12-month forward PE multiple – in other words stocks have become the cheapest they’ve been since April 2020.
S&P 500 Earnings Growth (% Change)
Source: Bloomberg.
King Dollar.
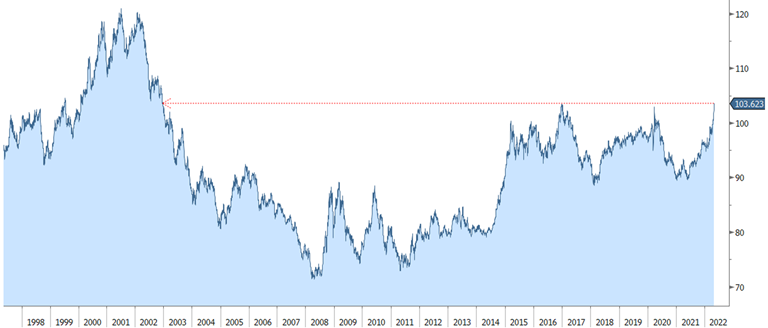
The US Dollar Index gained +4.7% in April, its fifth monthly advance in six months and its best month since January 2015. Bespoke Investment Group points out that there were only three trading days in the month in which the U.S. Dollar Index traded lower, which results in a monthly positivity rate of 86%. That is the third-highest positivity rate on record (since 1971), falling just short of July 1975 and May of 2012. Expectations for a more aggressive Fed tightening cycle and risk off sentiment due to geopolitical tensions led the dollar to its highest level since December 2002.
The U.S. Dollar approaches 20-year highs against other major world currencies
Source: Bloomberg.
Growth vs Value.
In five years ended 12/31/2021, the Russell 3000 Growth Index outperformed the Russell 3000 Value Index every single year and by a total magnitude of +197.4% to +67.1%. Complete domination, it was growth’s longest and largest stretch of outperformance since Russell debuted the indices in 1979. But the jig may be up for growth. In 2022, growth has trailed value in three of the four months, and is already behind value in performance by 13.6%. We’re only four months into the year, but that would represent growth’s largest annual underperformance to value since 2001.
Growth has lost its long running dominance over Value in 2022
Source: Bloomberg.
Yellow Light, not Red (yet).
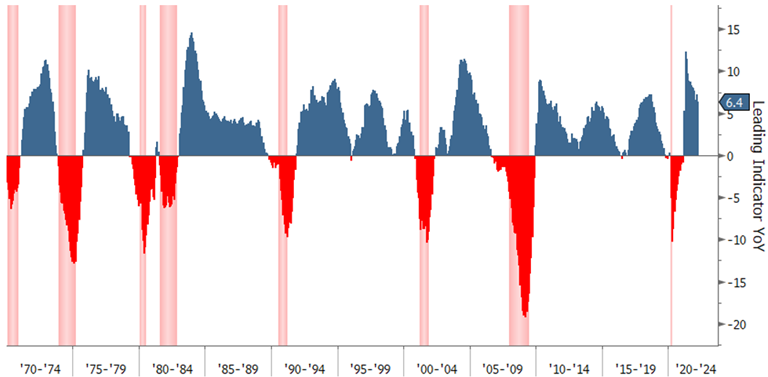
Last month we featured how the 3-month / 10-year U.S. Treasury yield curve was not corroborating the recession warning that the 2-year / 10-year Treasury yield curve flashed at the end of March via a very brief few days of inversion. In past recessions, the 3-month / 10-year had also inverted prior to the recession but currently it is still steepening and is nowhere near inverting. Similarly, in past recessions the Conference Board Leading Economic Index (LEI), an index of 10 economic variables that tend to move before changes in the overall economy, has typically slowed and rolled over at least 18-24 months prior to a recession occurring. The year-on-year (YoY) change in the LEI have a virtually flawless track record in predicting the onset of recession. Every recession since 1970 has come with a YoY decline in this composite reading of 10 economic and market measures, and there’s been only one instance (indeed just a single month!) when it gave a false signal of impending economic contraction. The latest release of the LEI showed nothing near a recession warning, with a +6.4% YoY gain, the absolute level of the index hit an all-time high of 119.8, and seven of the ten components were positive. So, the index is well-away from going negative on a YoY basis.
The LEI suggests economic growth will continue through 2022
The LEI rose again despite headwinds from the war in Ukraine and high inflation
Source: The Conference Board, Bloomberg. Note: shaded areas indicate U.S. recessions.
Unaffordability Housing?
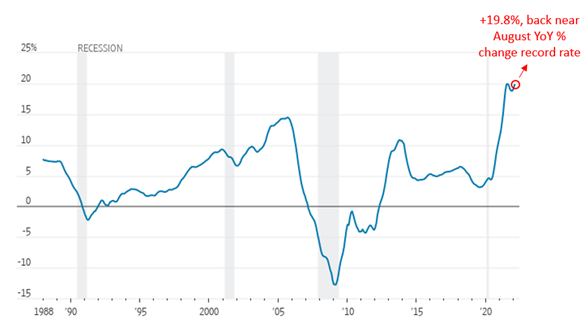
The S&P CoreLogic Case-Shiller National Home Price Index, which measures average home prices in major metropolitan areas across the U.S., rose +19.8% in the year that ended in February, up from a +19.1% annual rate in January. February marked the highest annual rate of price growth since August 2021. The low inventory of homes for sale has made it difficult for buyers to compete and pushed prices higher. In addition to higher home prices, the average 30-year mortgage rate jumped from 3.1% at the end of 2021 to 5.0% by mid-April, adding hundreds of dollars to the typical monthly mortgage payment. US home prices hit a record high in February for the 37th month in a row. Economists expect home-price growth to begin to slow in the coming months as rising mortgage interest rates reduce buyers’ purchasing power and price some shoppers out of the market. The median price of a new home is now 6.5x higher than the median household income, a new all-time high. Housing has never been more unaffordable relative to incomes.
S&P CoreLogic Case-Shiller national home-price index
Percent change from one year earlier
Source: Bloomberg.
Asset Class Performance
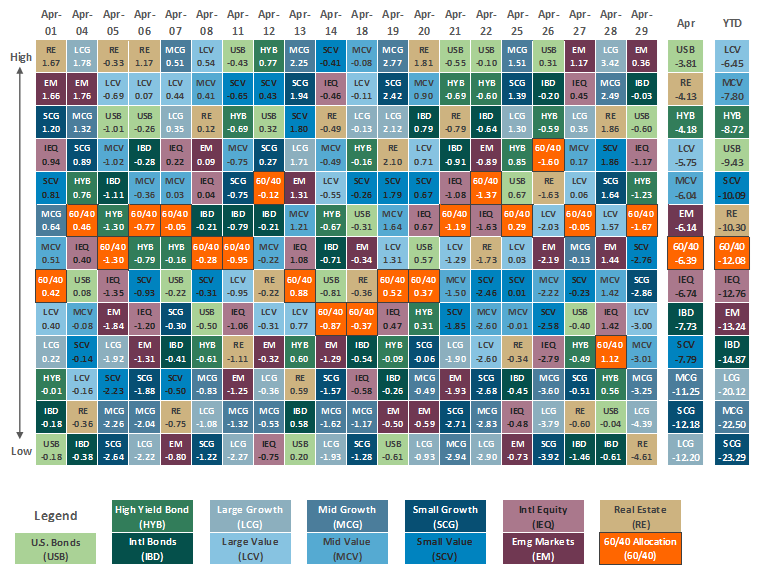
The Importance of Diversification. Diversification mitigates the risk of relying on any single investment and offers a host of long-term benefits, such as lowering portfolio volatility, improving risk-adjusted returns, and helping investments to compound more effectively.
Source: Bloomberg. Asset‐class performance is presented by using market returns from an exchange‐traded fund (ETF) proxy that best represents its respective broad asset class. Returns shown are net of fund fees for and do not necessarily represent performance of specific mutual funds and/or exchange-traded funds recommended by The Retirement Planning Group. The performance of those funds may be substantially different than the performance of the broad asset classes and to proxy ETFs represented here. U.S. Bonds (iShares Core U.S. Aggregate Bond ETF); High‐Yield Bond (iShares iBoxx $ High Yield Corporate Bond ETF); Intl Bonds (SPDR® Bloomberg Barclays International Corporate Bond ETF); Large Growth (iShares Russell 1000 Growth ETF); Large Value (iShares Russell 1000 Value ETF); Mid Growth (iShares Russell Mid-Cap Growth ETF); Mid Value (iShares Russell Mid-Cap Value ETF); Small Growth (iShares Russell 2000 Growth ETF); Small Value (iShares Russell 2000 Value ETF); Intl Equity (iShares MSCI EAFE ETF); Emg Markets (iShares MSCI Emerging Markets ETF); and Real Estate (iShares U.S. Real Estate ETF). The return displayed as “Allocation” is a weighted average of the ETF proxies shown as represented by: 30% U.S. Bonds, 5% International Bonds, 5% High Yield Bonds, 10% Large Growth, 10% Large Value, 4% Mid Growth, 4% Mid Value, 2% Small Growth, 2% Small Value, 18% International Stock, 7% Emerging Markets, 3% Real Estate.
Chris Bouffard is CIO of The Retirement Planning Group (TRPG), a Registered Investment Adviser. He has oversight of investments for the advisory services offered through TRPG.
Disclaimer: Information provided is for educational purposes only and does not constitute investment, legal or tax advice. All examples are hypothetical and for illustrative purposes only. Past performance of any market results is no assurance of future performance. The information contained herein has been obtained from sources deemed reliable but is not guaranteed. Please contact TRPG for more complete information based on your personal circumstances and to obtain personal individual investment advice.

